Log Investigation
Most access tickets arrive with a time attached: “it did not work this morning at about 10:40”. Answering means opening the web logs, then the firewall logs, then ZPA, then checking whether anyone else had the same problem, and lining up the results by hand. The Log Investigation does those reads for you, one after another, and returns one timeline with diagnosis cards that name the likely cause and the next step.
It is for the help desk engineer holding a ticket, and for anyone who has to explain afterwards what happened at a given moment.
When to use it
- A ticket with a time: a user could not reach a host or a cloud app at a known moment.
- A ticket with only a day: “sometime yesterday”. Only the day finds the moment for you.
- A failed request in a HAR: jump from the request straight to an investigation at that exact time.
- “Is it just me?”: the investigation checks whether other users failed on the same target in the same window.
Where to find it in the UI
Open the Troubleshooting Engine and go to the Investigation tab. The user and the destination come from the scenario selected in the rail, so build the criteria first.
You can also start from the HAR Analysis panel: Investigate this request on a failed request opens the tab with the host and the time of that request already filled in.
Step by step
-
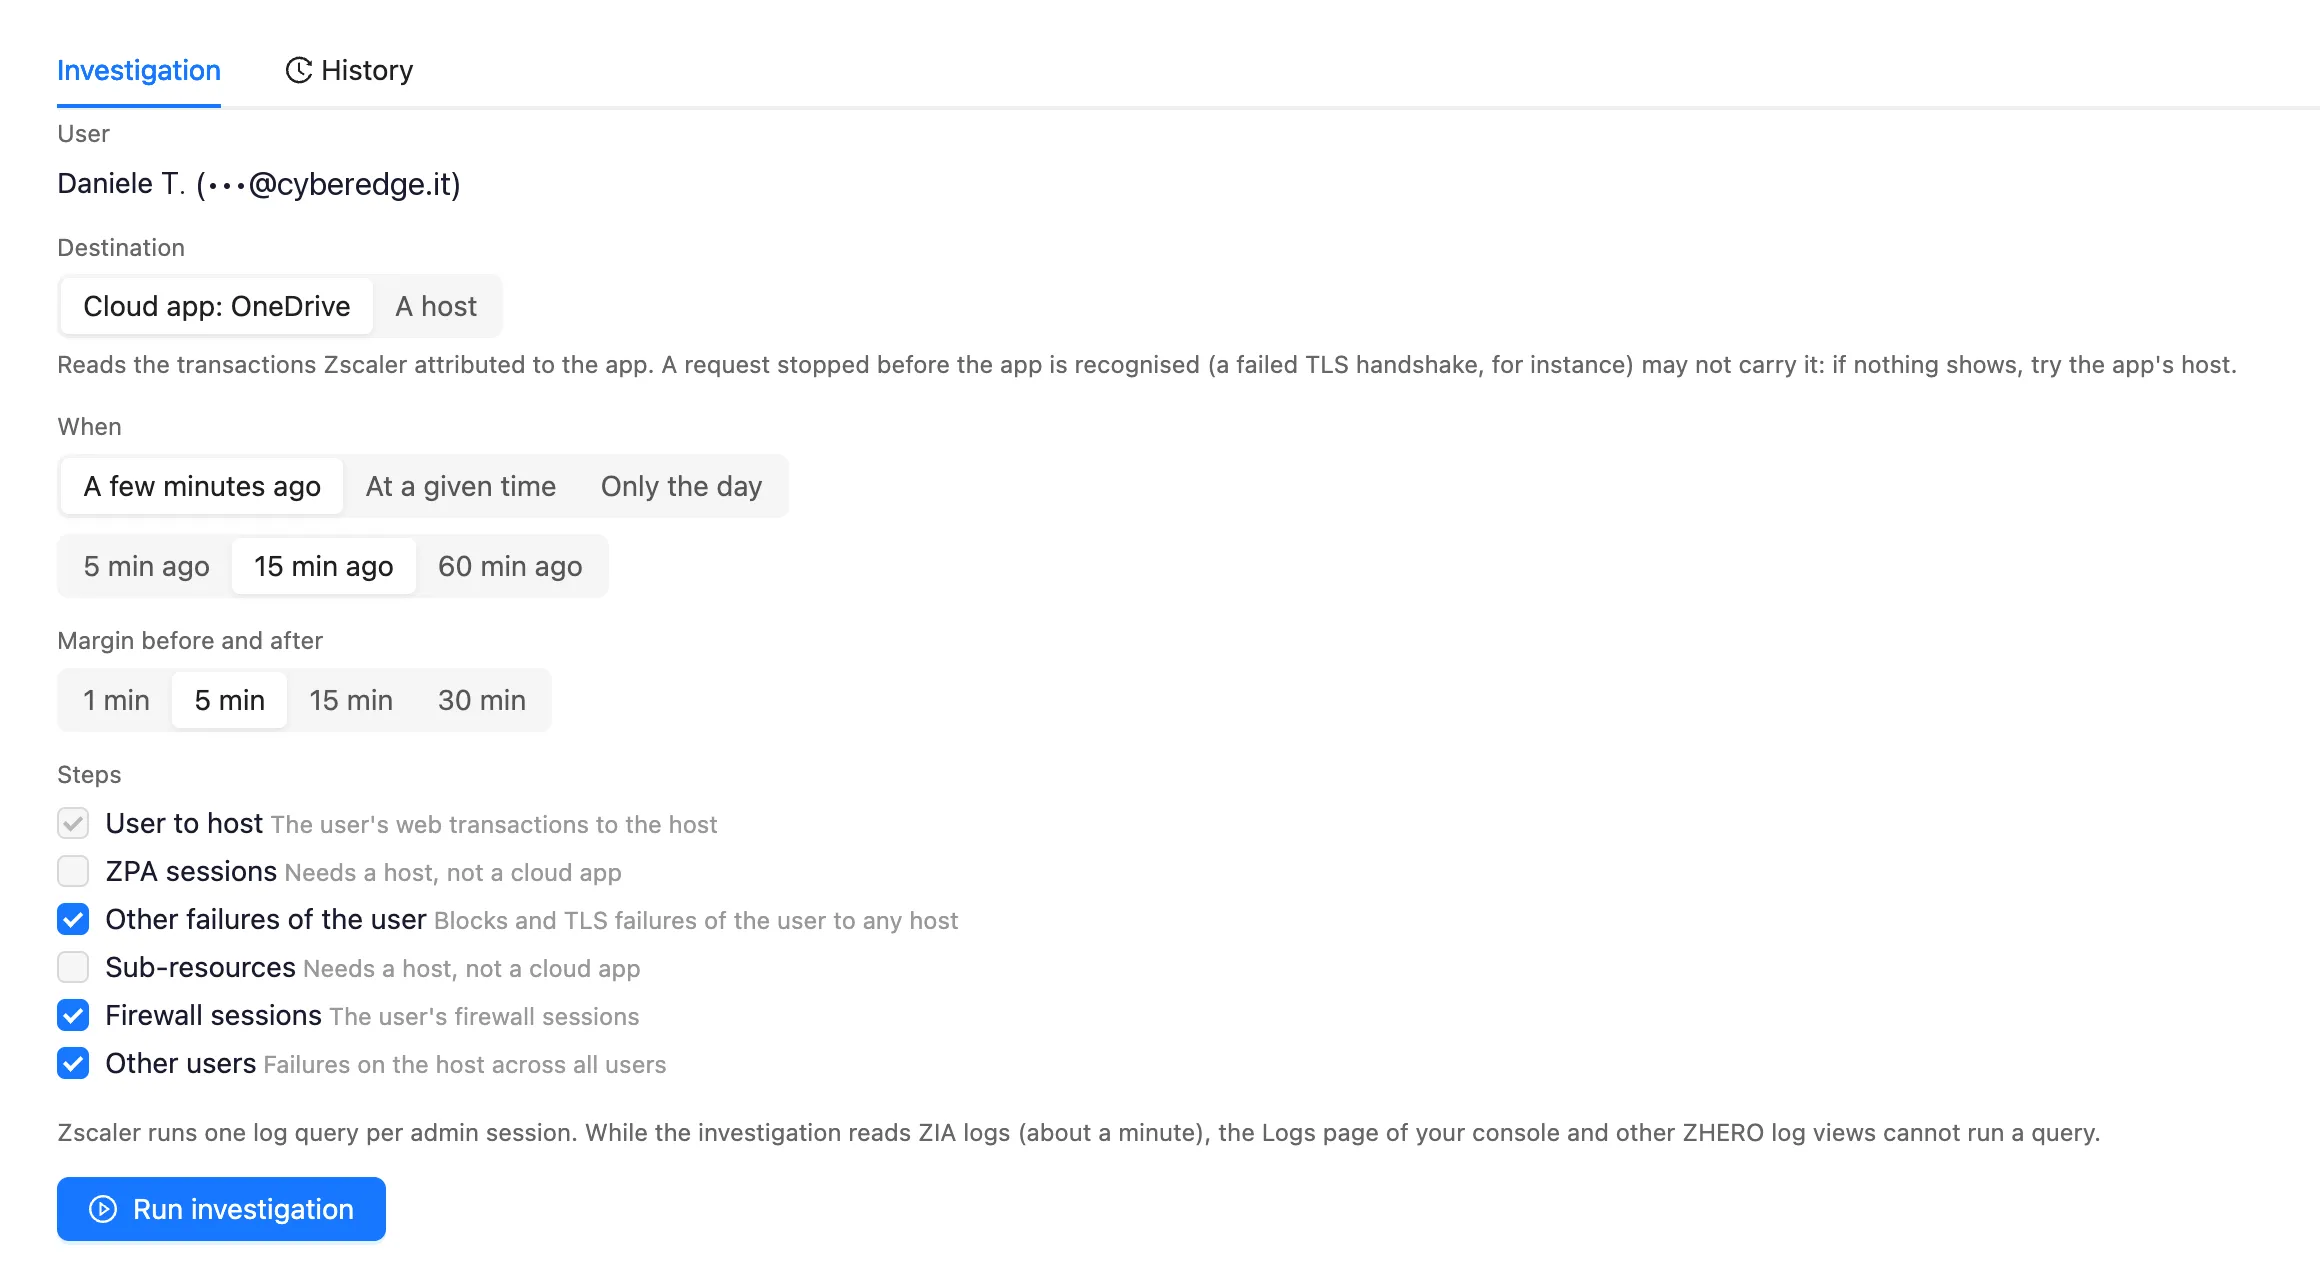
Select the scenario in the rail. The user is taken from it and is not editable here.
-
Choose the target. When the scenario has a cloud app, choose between the cloud app as a whole and a host. For a host, type it in the host field: a plain host name is searched as an exact match, and a leading
*.includes every subdomain. -
Choose when. Three ways, depending on what the ticket says:
Option Use it when A few minutes ago (5, 15 or 60 minutes) The user is on the phone right now At a given time, with the timezone The ticket has a time Only the day The ticket has a day and no time (see below) Set the margin before and after the moment: 1, 5, 15 or 30 minutes, 5 by default. A wider margin catches more, and costs more time on each read.
-
Choose the steps. Each step is one log read, run in this order:
Step What it reads User to host The user’s traffic to the target. Always on ZPA sessions The user’s ZPA sessions towards the host Other failures of the user Everything else that failed for the same user in the window Sub-resources The other hosts the page loads, where the real failure often hides Firewall sessions The user’s firewall sessions in the window Other users Whether other users failed on the same target ZPA sessions and Sub-resources need a host, so they are not offered when the target is a cloud app.
-
Press Run investigation. Nothing runs before you do. The reads go one after another and the timeline fills in as they complete.
-
Read the diagnosis cards, then the timeline behind them.
Reading the result
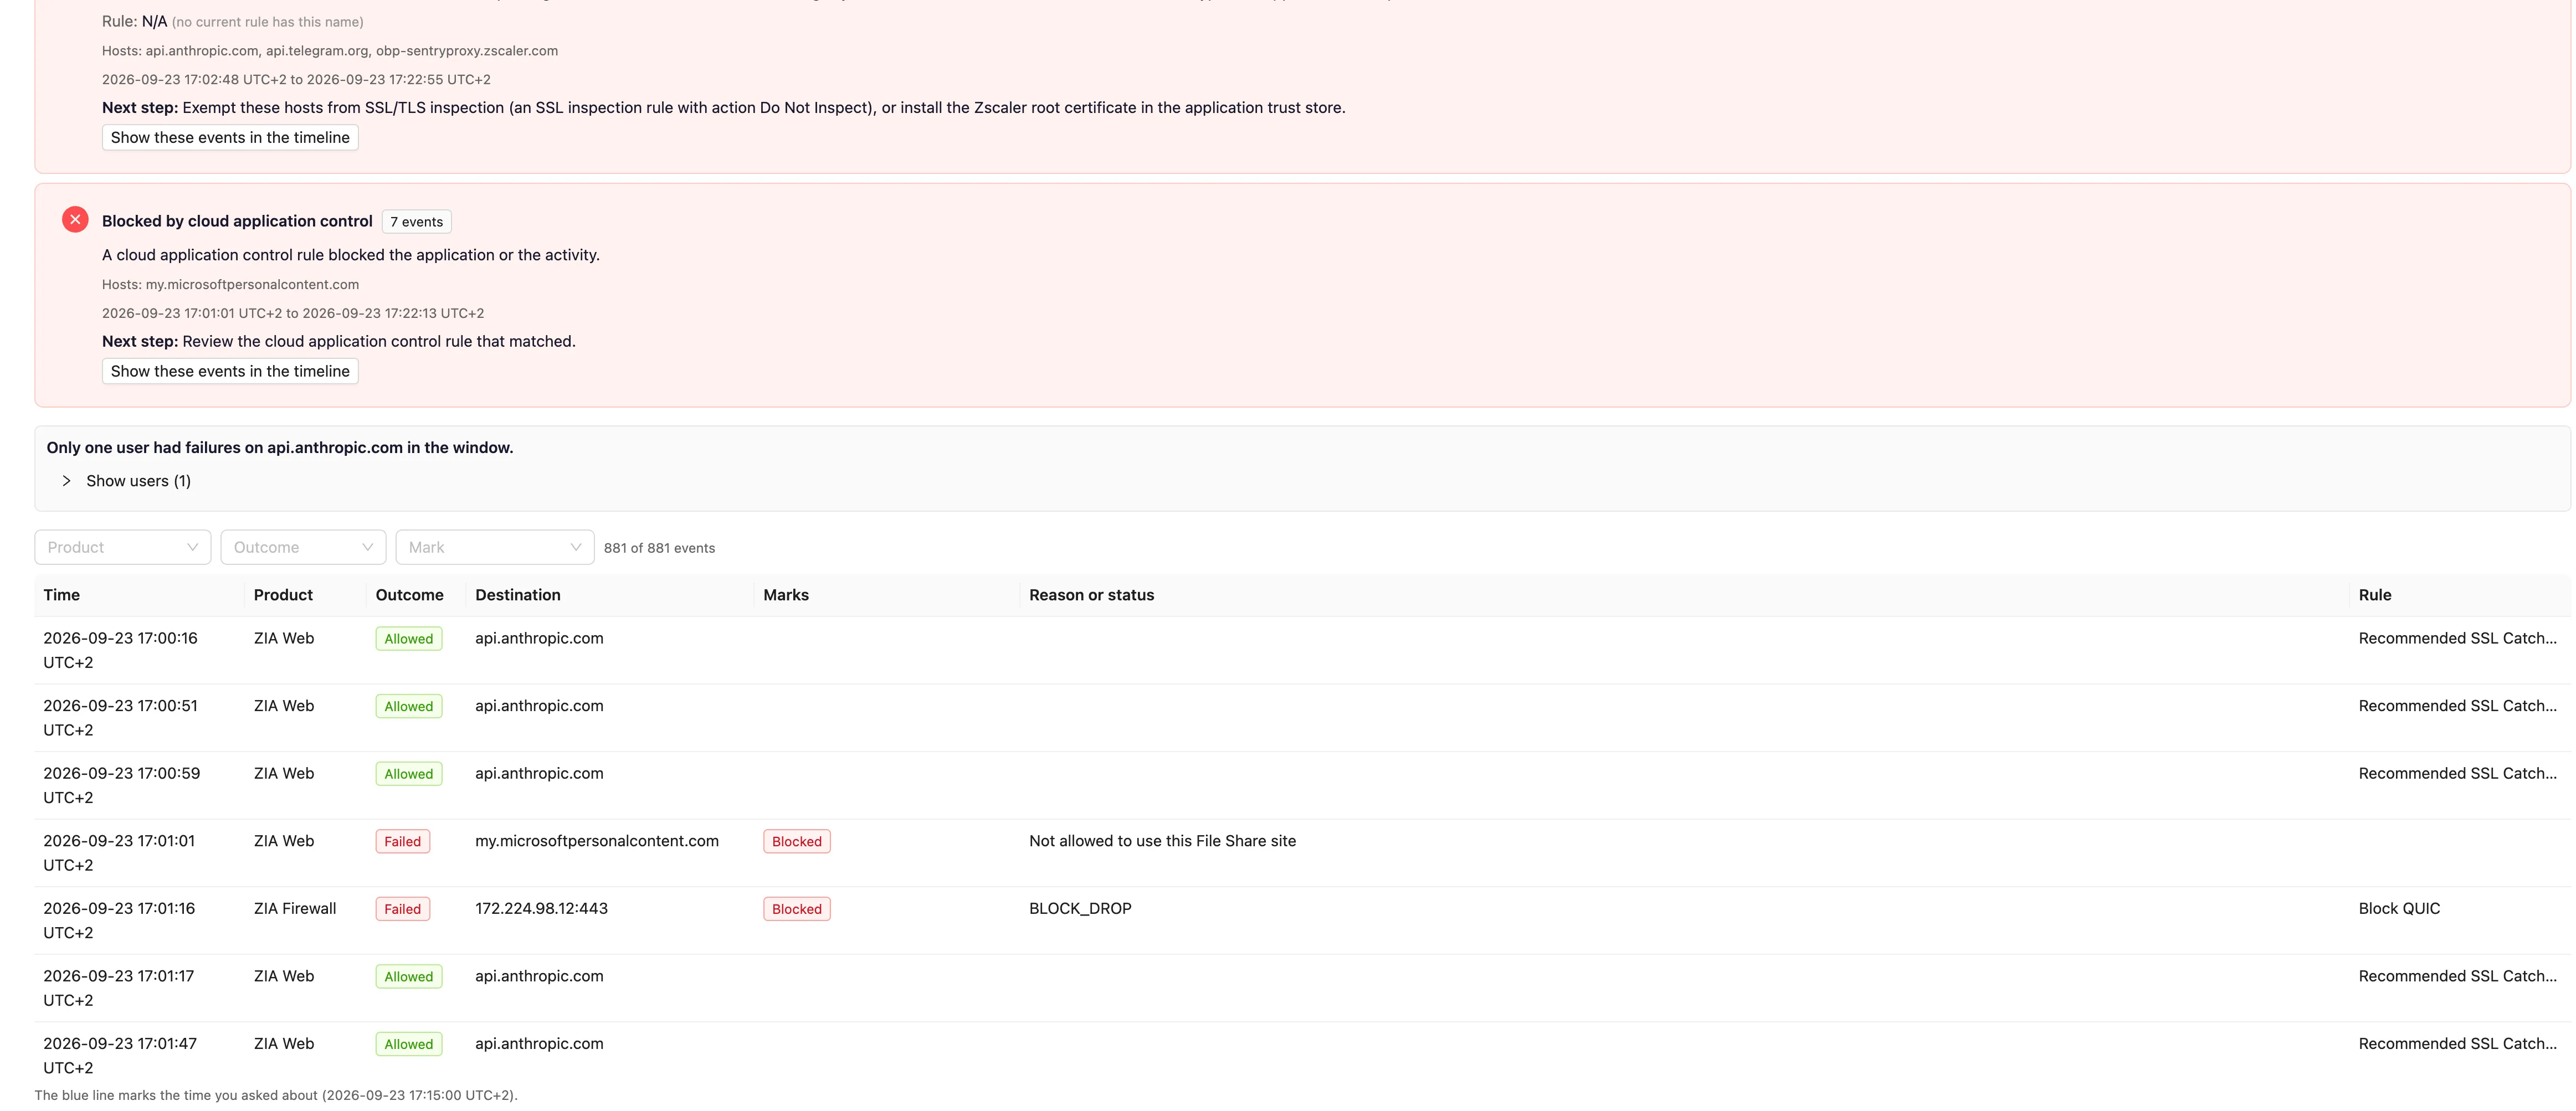
The result is one timeline that merges every read, in time order, and a set of diagnosis cards on top. Each card has a title that names the cause, a summary of the evidence, and a next step. Show these events in the timeline jumps to the events behind the card.
The causes the cards recognise:
| Area | Diagnosis |
|---|---|
| Certificates | The application does not trust the inspection certificate; the destination presented a certificate Zscaler does not accept |
| Policy | Blocked by the SSL/TLS inspection policy, by URL filtering, by cloud application control, by data loss prevention, by file type control, by the firewall |
| Threat protection | Blocked or held by the sandbox; blocked as a threat; dropped by intrusion prevention |
| Performance | The destination server answered with an error; the destination server was slow; Zscaler processing was slow |
| ZPA | ZPA sessions failed |
When a failure does not fit any of these, the card says so (“Failed for a reason ZHERO does not classify yet”) and the timeline still shows the raw events. The Other users step adds how many other users had failures on the same host in the window.
Only the day
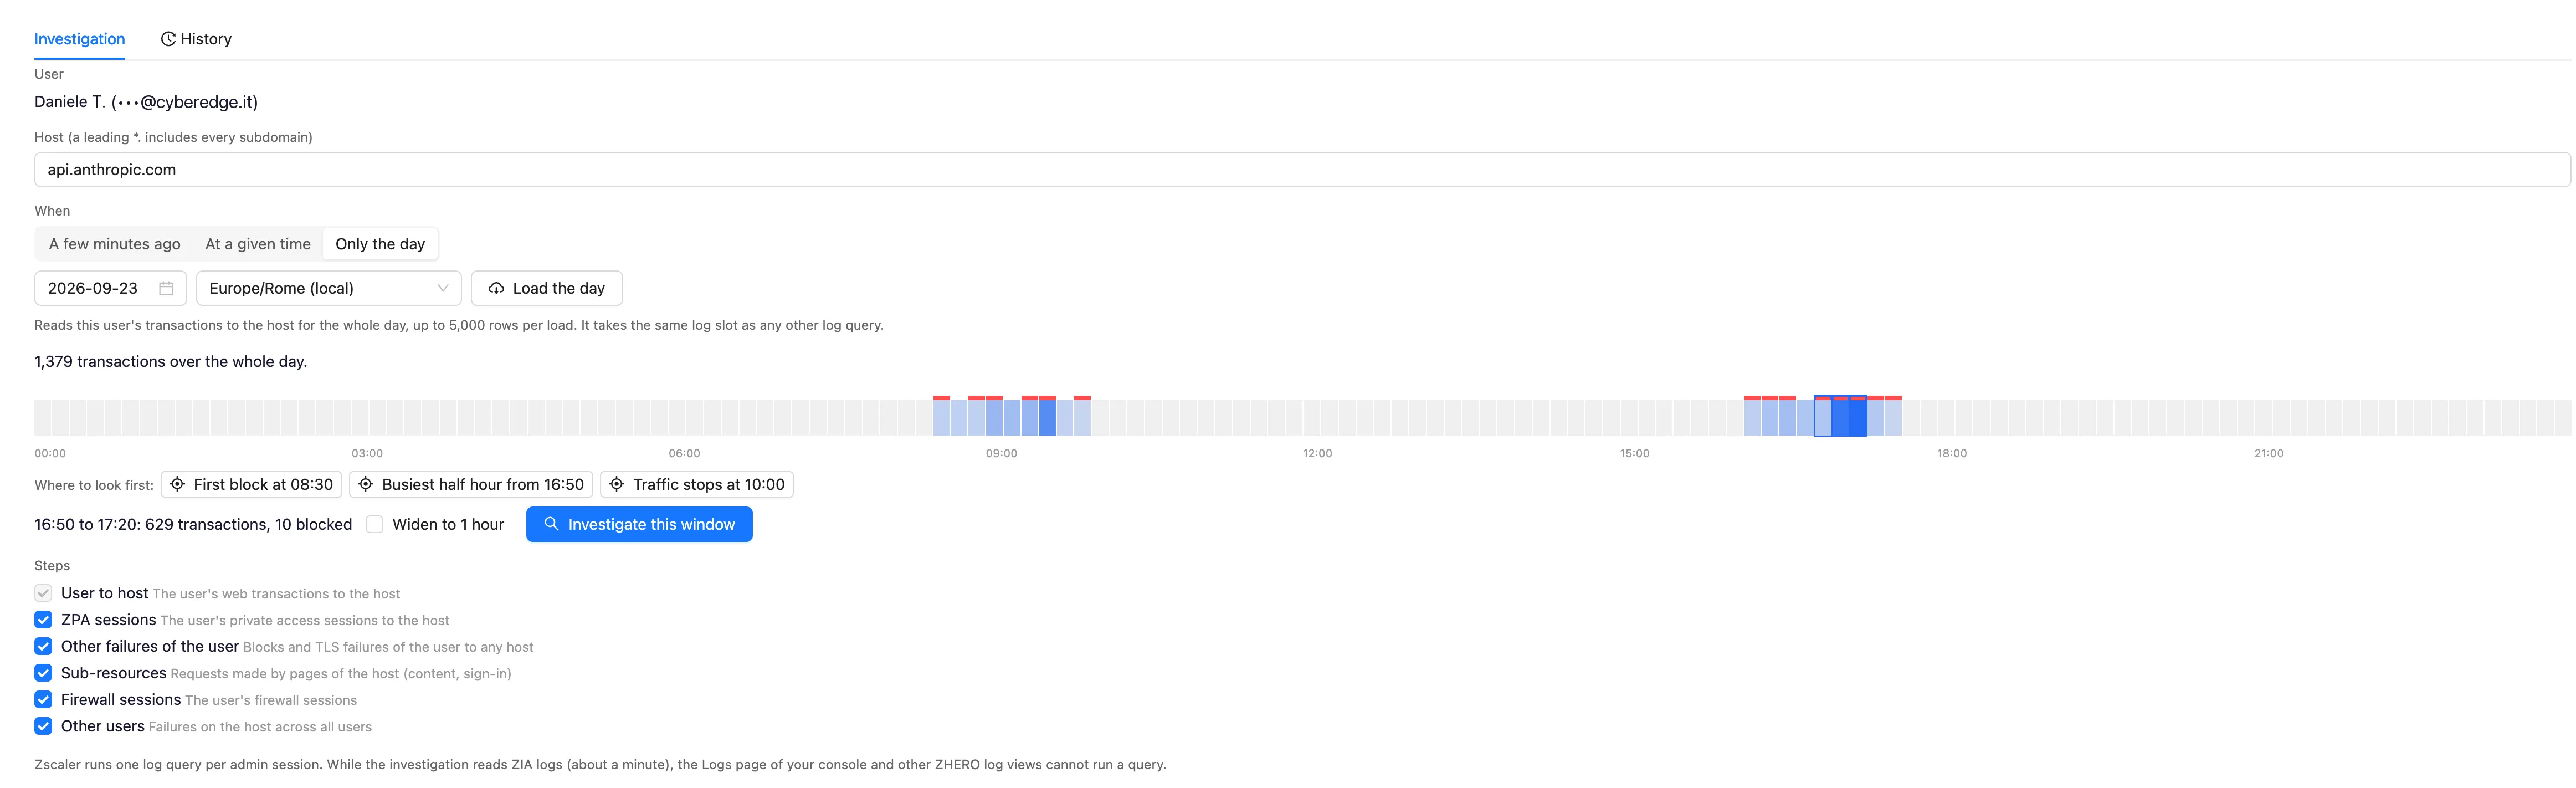
When the ticket gives a day but no time, choose Only the day, pick the day of the ticket in the calendar and its timezone, then Load the day. ZHERO reads the user’s traffic towards the target for that day in one pass and draws it as a heatmap of 144 cells, ten minutes each. Cells that contain a block are marked in red.
Above the heatmap, Where to look first suggests the moments that usually matter: the first block of the day, the busiest half hour, the moment traffic stops. Click a cell to select a 30-minute window around it (Widen to 1 hour if you need more), then Investigate this window to run the investigation there.
Only the day needs a scenario with a ZIA user. If the day holds more traffic than a single read returns, the page says so and offers Read the rest.
Saving and naming
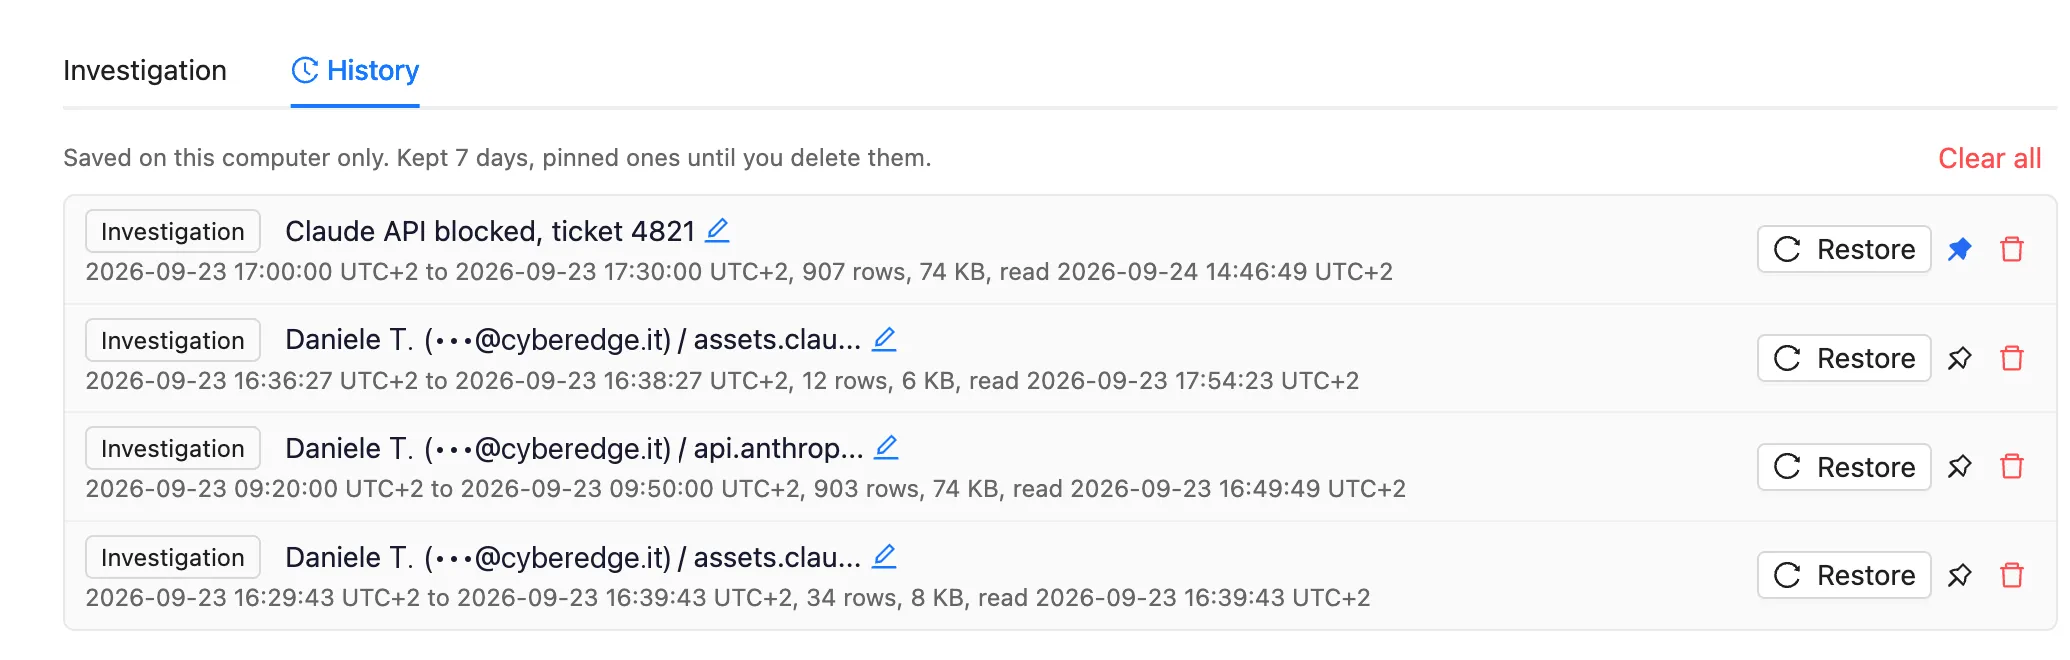
Every investigation is saved in the History sub-tab, next to Investigation. From there:
- Restore reopens an investigation with its results, without running any query.
- The pencil gives it a name of your own (up to 80 characters).
- The pin keeps it: unpinned entries are kept for 7 days, up to the latest 10.
- An investigation that did not finish is saved as Interrupted and can be picked up with Resume.
What to watch
- The cards before the timeline. The timeline is the evidence; the cards are the reading. Start from the card, then check its events.
- Sub-resources. “The site does not work” often means the page loaded and one of the hosts it depends on did not. That is the step that finds it.
- Other users. One user failing is a user problem; twenty users failing on the same host is a policy or destination problem.
- Certificate cards. An application that does not trust the inspection certificate is fixed with an SSL inspection exemption or by deploying the certificate, not by changing URL filtering.
- The margin. Start narrow. Widen only if the timeline is empty around the moment.
Limits and notes
- The Investigation is part of the Troubleshooting Engine and needs the full licence.
- One log query at a time. Zscaler allows one log job per admin session, which is why nothing runs until you press Run: an automatic read would replace the one you already have running.
- Each step reads up to 5,000 rows. On a very busy user, narrow the margin to keep the window complete.
- A read that stops advancing is stopped after a few minutes, with a message, rather than left hanging.
- The logs are Zscaler’s. The investigation reads them through your authenticated session, as the console would; what your admin role cannot read, it cannot read either.
- History is stored locally in your browser.
FAQ
Why do I have to press Run? The form is already filled in. Because Zscaler runs one log query per admin session. Starting one automatically would silently cancel whatever you were already running, in the drawer or in a Logs panel.
Can I investigate a whole cloud app instead of one host? Yes, when the scenario’s destination is a cloud app. The steps that need a single host (ZPA sessions and sub-resources) are then not available.
The timeline is empty. Check the timezone and the margin first: an investigation at the right time in the wrong timezone reads an hour where nothing happened. If the ticket is vague, use Only the day.
Does the investigation change anything in the tenant? No. It only reads logs.
Related pages
- Troubleshooting Engine: the verdict and the configuration side of the same case
- Floating Logs Panel: the raw logs, filtered on any entity
- ZPA Diagnostics Engine: the ZPA population view
- SSL Inspection: where certificate diagnoses usually lead
Next steps
- Take a ticket with a time and run the investigation with the default margin
- Read the first diagnosis card and follow it into the timeline
- Next time a ticket says only “yesterday”, try Only the day
- Name the investigation you want to keep, and pin it