ZCC Fleet Health
ZCC Fleet Health scores, compares and remediates your Zscaler Client Connector deployment across the entire device fleet. It replaces what used to be the least enjoyable part of any Zscaler assessment, cross-referencing App Profiles, Forwarding Profiles and PAC files by hand across screens that cannot even be opened side by side, with a single dashboard that reads the whole fleet, scores it, and tells you what to fix first.
Video demo
Why this exists
A Zscaler Client Connector deployment is defined by three intertwined objects: an App Profile references a Forwarding Profile, which in turn can reference several PAC files. Each one carries dozens of parameters, each lives on a different console screen, and the console will not let you hold more than one open at a time. Comparing two app profiles, or understanding how a forwarding profile and its PAC files actually behave, has always meant exporting, screenshotting, and rebuilding the picture by hand.
Worse, the console does not tell you how the fleet uses those profiles. Profiles are assigned to groups across thousands of users, and the only way to know which are actually in use is to export the enrolled-device list to CSV, pivot it in a spreadsheet, and cross-reference device counts per profile.
ZCC Fleet Health does all of that in one pass. It reads the profiles and the fleet telemetry, scores every profile combination against a library of best practices, and gives you both a per-profile and a device-weighted view of where the deployment really stands.
Running an assessment
The assessment is triggered with a single click. ZHERO downloads the profile configuration and the enrolled-device and device-status data directly from the tenant, then computes the scores. The run is manual by design: it is computationally heavy, so it happens on demand rather than continuously, and the Executive Summary shows when it was last computed.
Executive Summary: two scores, not one
The Executive Summary opens on the two fleet scores, side by side, each with an A-to-E grade and a four-vertical radar (Security, Resilience, Deployment Quality, Service Health):
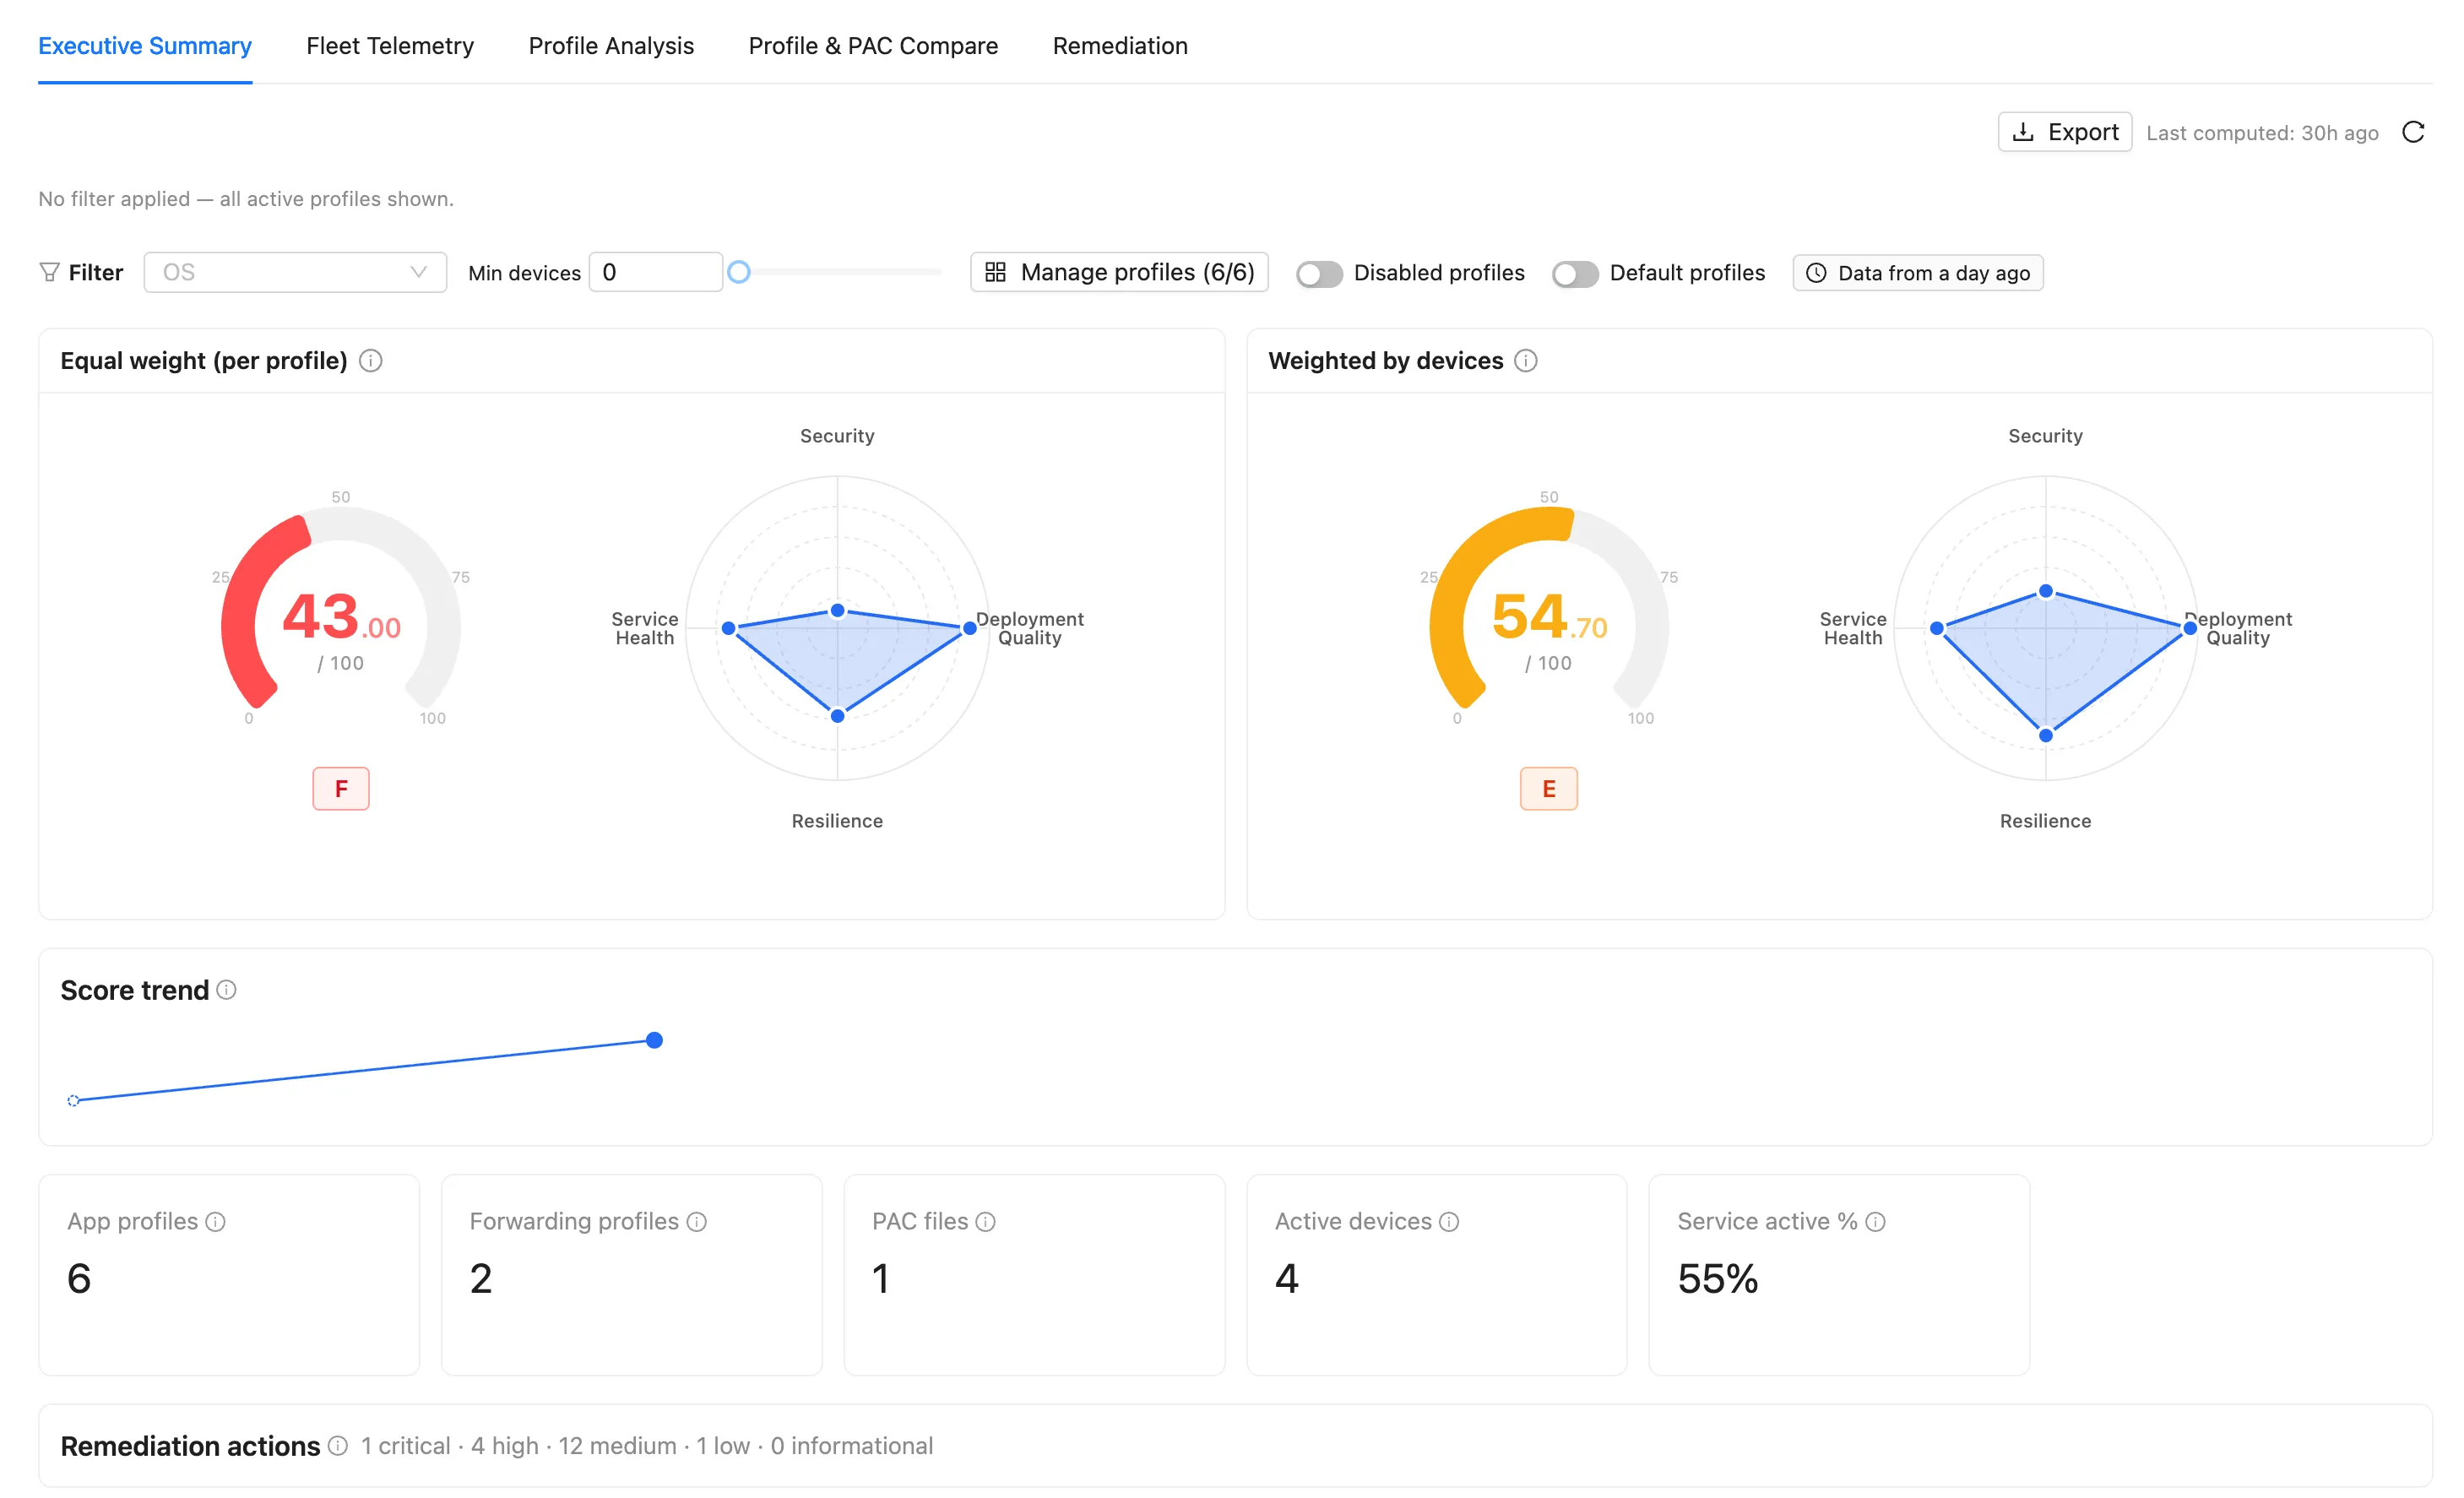
- Equal weight (per profile): every profile counts the same, regardless of how many devices run it. This is the quality of your configuration in the abstract.
- Weighted by devices: the same checks, but weighted by how many devices actually run each profile. This is the posture your users are really exposed to.
The two can diverge sharply, because the device distribution moves the number a lot. A neglected profile running on thousands of devices drags the weighted score down far more than the per-profile average suggests, and a well-configured profile that nobody uses flatters it. Reading both together is the point: one tells you how good your profiles are, the other tells you how good your fleet actually is.
Below the scores, a Score trend tracks how the fleet moves over time, and a row of fleet KPIs (App Profiles, Forwarding Profiles, PAC files, active devices, service-active percentage) frames the numbers. The Remediation actions summary counts the open findings by severity.
Fleet Telemetry: the blind spots nobody looks at
The Fleet Telemetry tab turns the device data into the metrics that usually go unseen, because producing them by hand is too tedious to bother with:
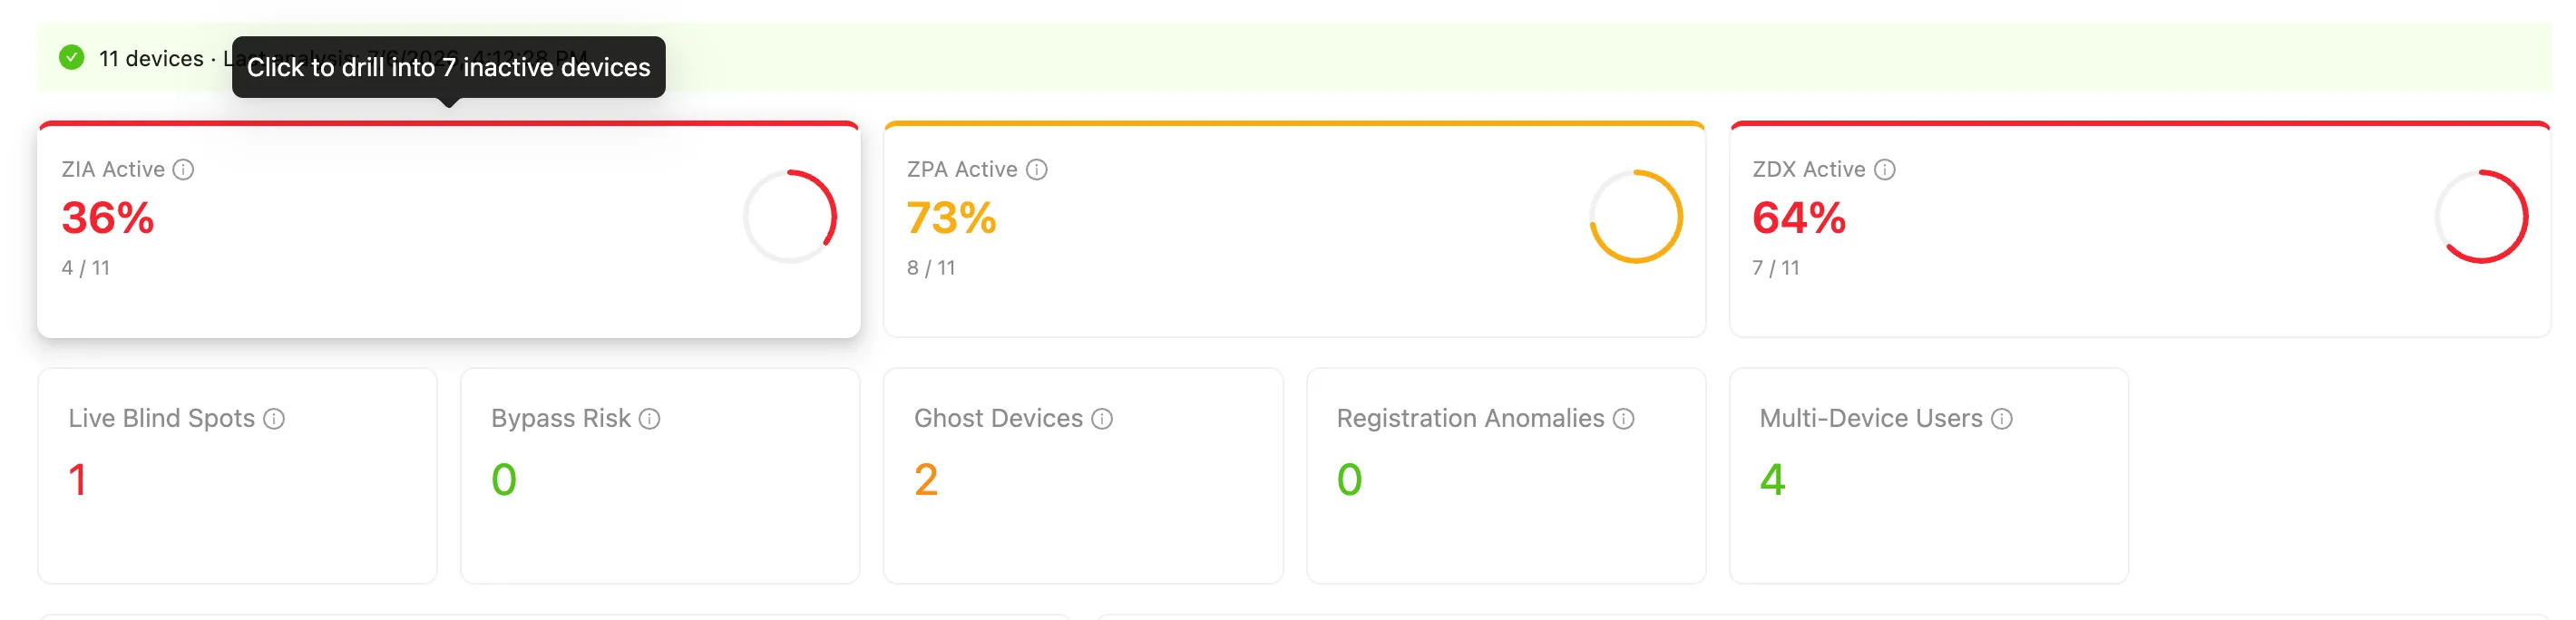
- ZIA / ZPA / ZDX Active %: how many enrolled devices are actually running each service, not just how many are entitled to
- Live Blind Spots: devices where a service that should be on is off, the single most dangerous gap on this screen
- Bypass Risk, Ghost Devices, Registration Anomalies, Multi-Device Users: the other patterns worth catching before they become incidents
The Live Blind Spots metric is where deployments most often surprise their own owners. A common one: an App Profile sets a password to stop users from disabling ZIA, but the password leaks and no automatic re-activation timer is configured, so devices sit with ZIA off for days or weeks without anyone noticing. On a large fleet that can be hundreds of devices running with protection silently disabled.
Profile Analysis and the Coverage Heatmap
The Profile & PAC Compare tab is where the manual cross-referencing disappears. The High Level Compare view lays every profile against every best-practice check as a coverage heatmap, grouped by App Profile, Forwarding Profile and PAC file:
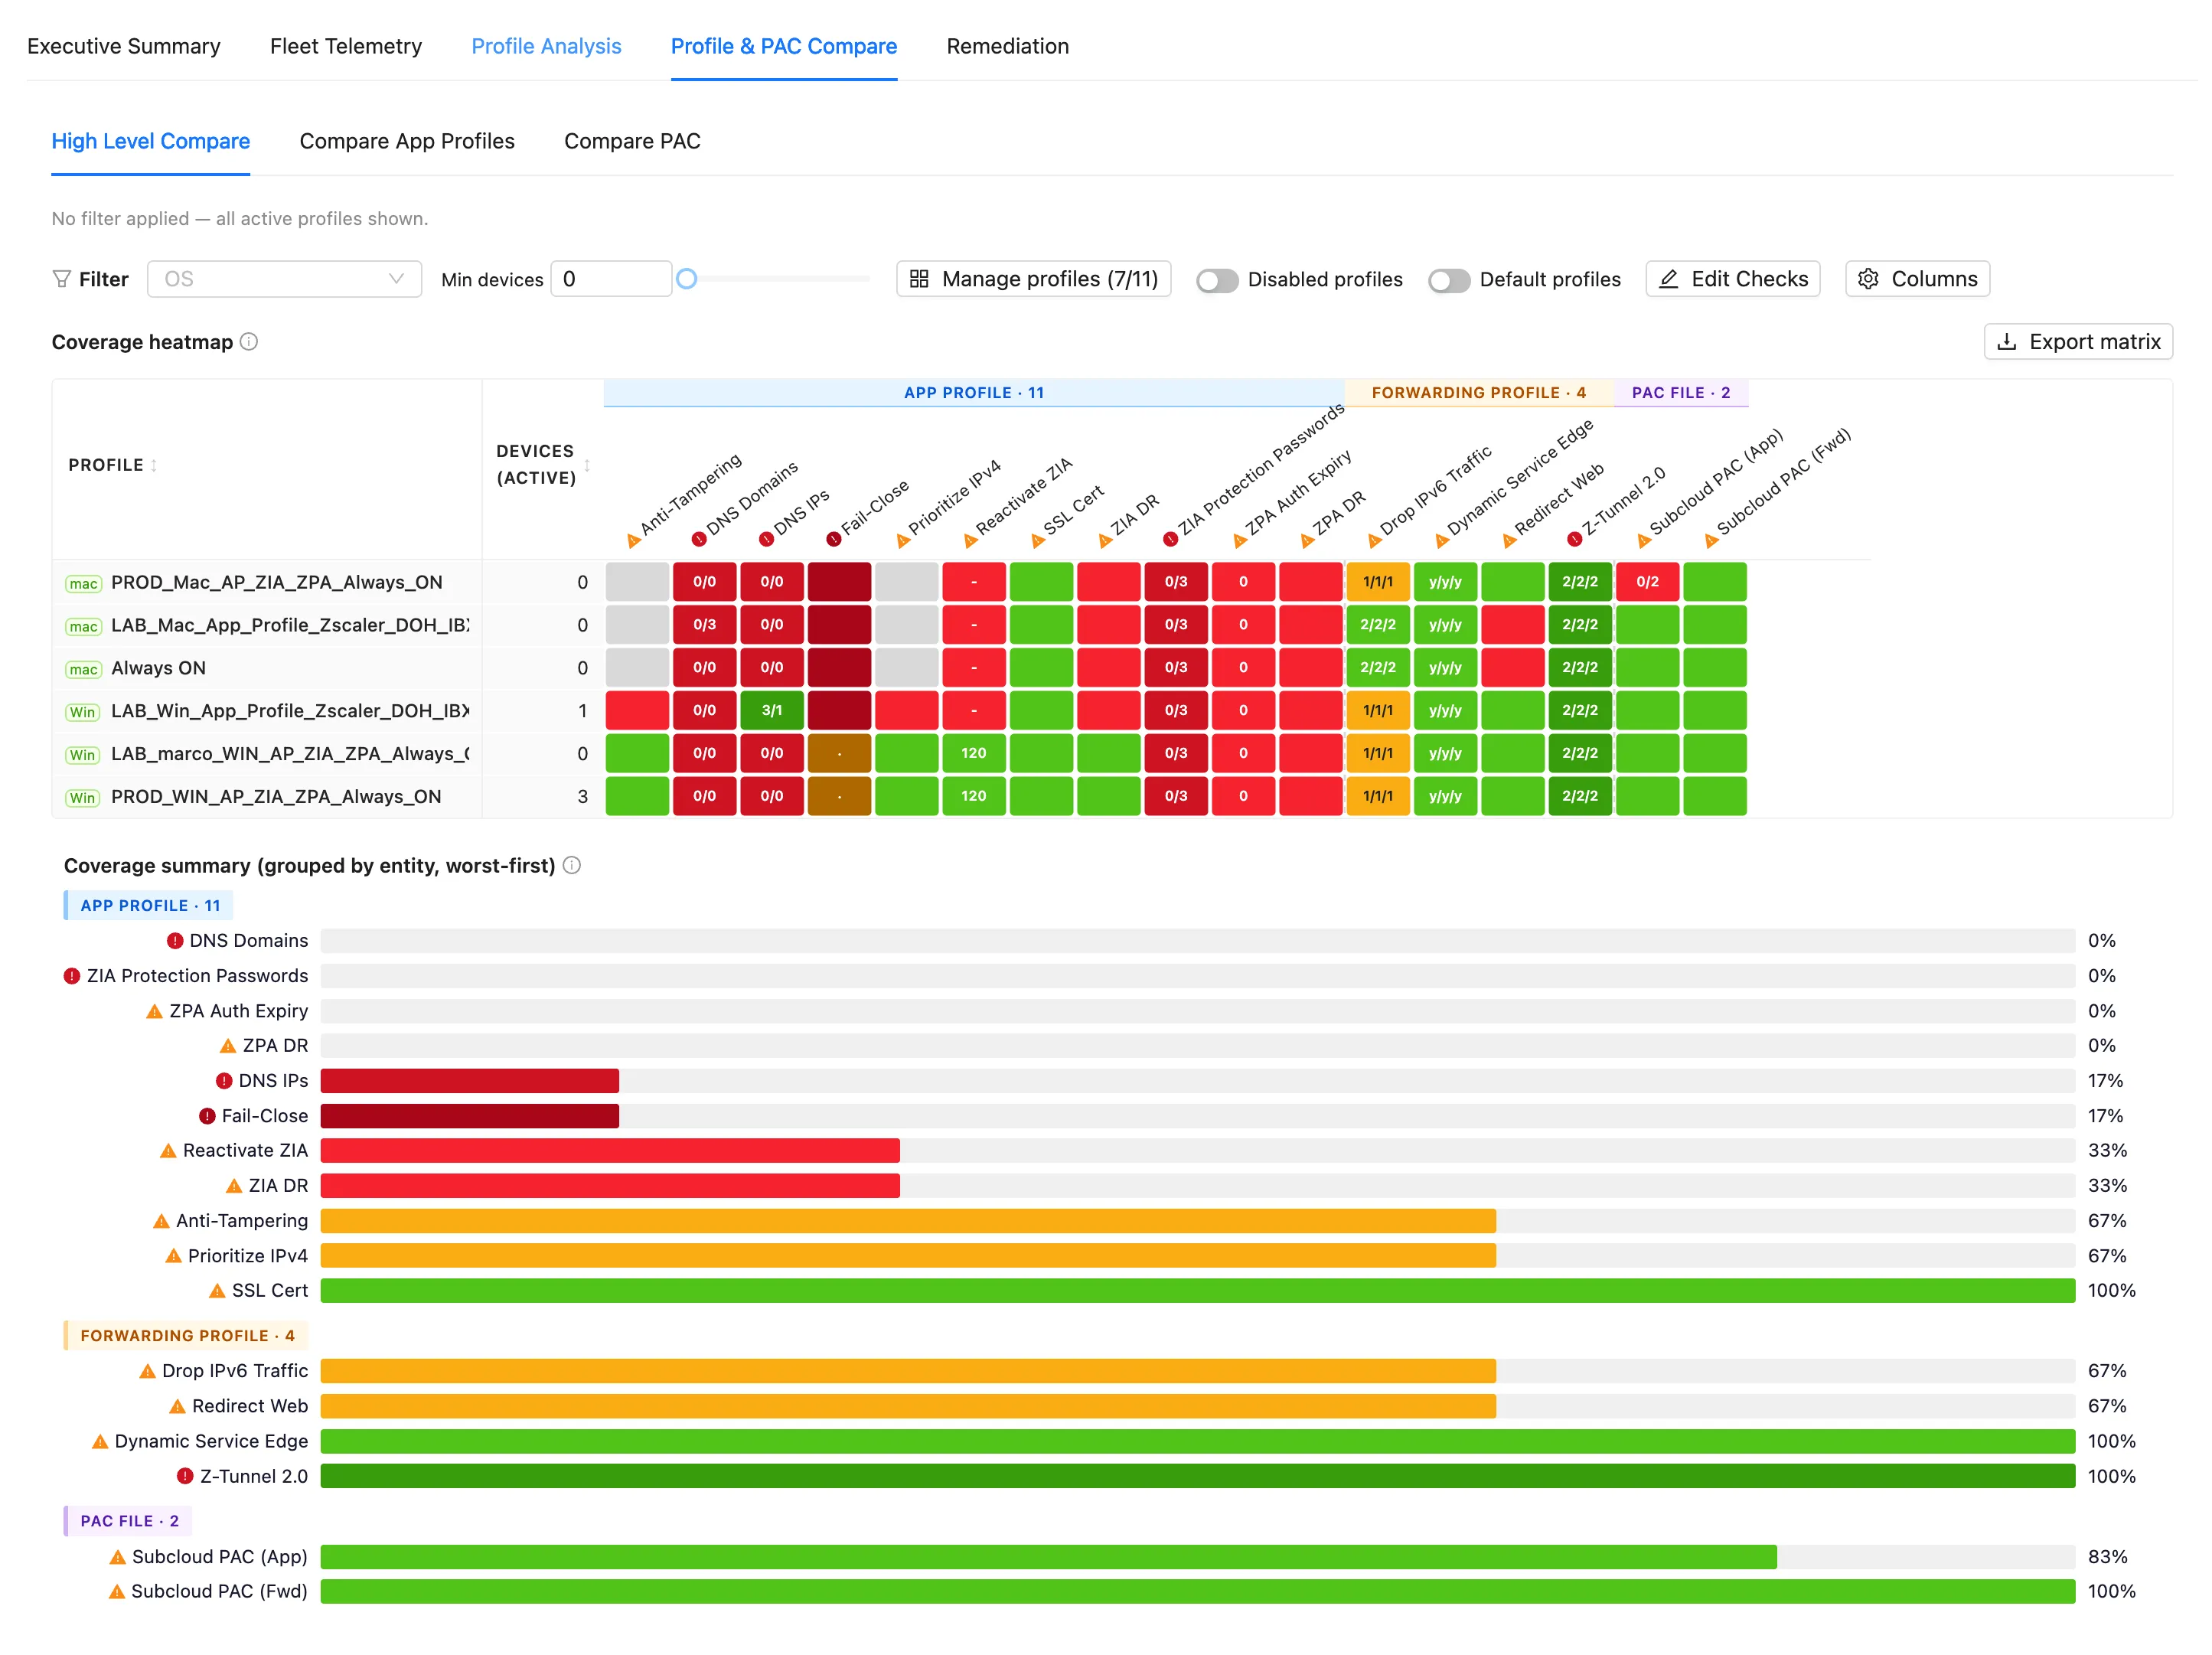
Green, amber and red cells show, at a glance, which checks pass on which profiles. Below the heatmap, a Coverage summary grouped by entity, worst-first ranks the checks by how poorly they are covered across the fleet, so a check sitting at 0% (say, DNS Domains or ZIA Protection Passwords) rises straight to the top. You can filter by OS, by minimum device count, and export the matrix.
Compare App Profiles
The Compare App Profiles view pivots two or more profiles side by side, expanding the configuration into comparable rows: assigned users, DNS tunnel inclusion and exclusion ranges, packet-tunnel excludes, and the rest:
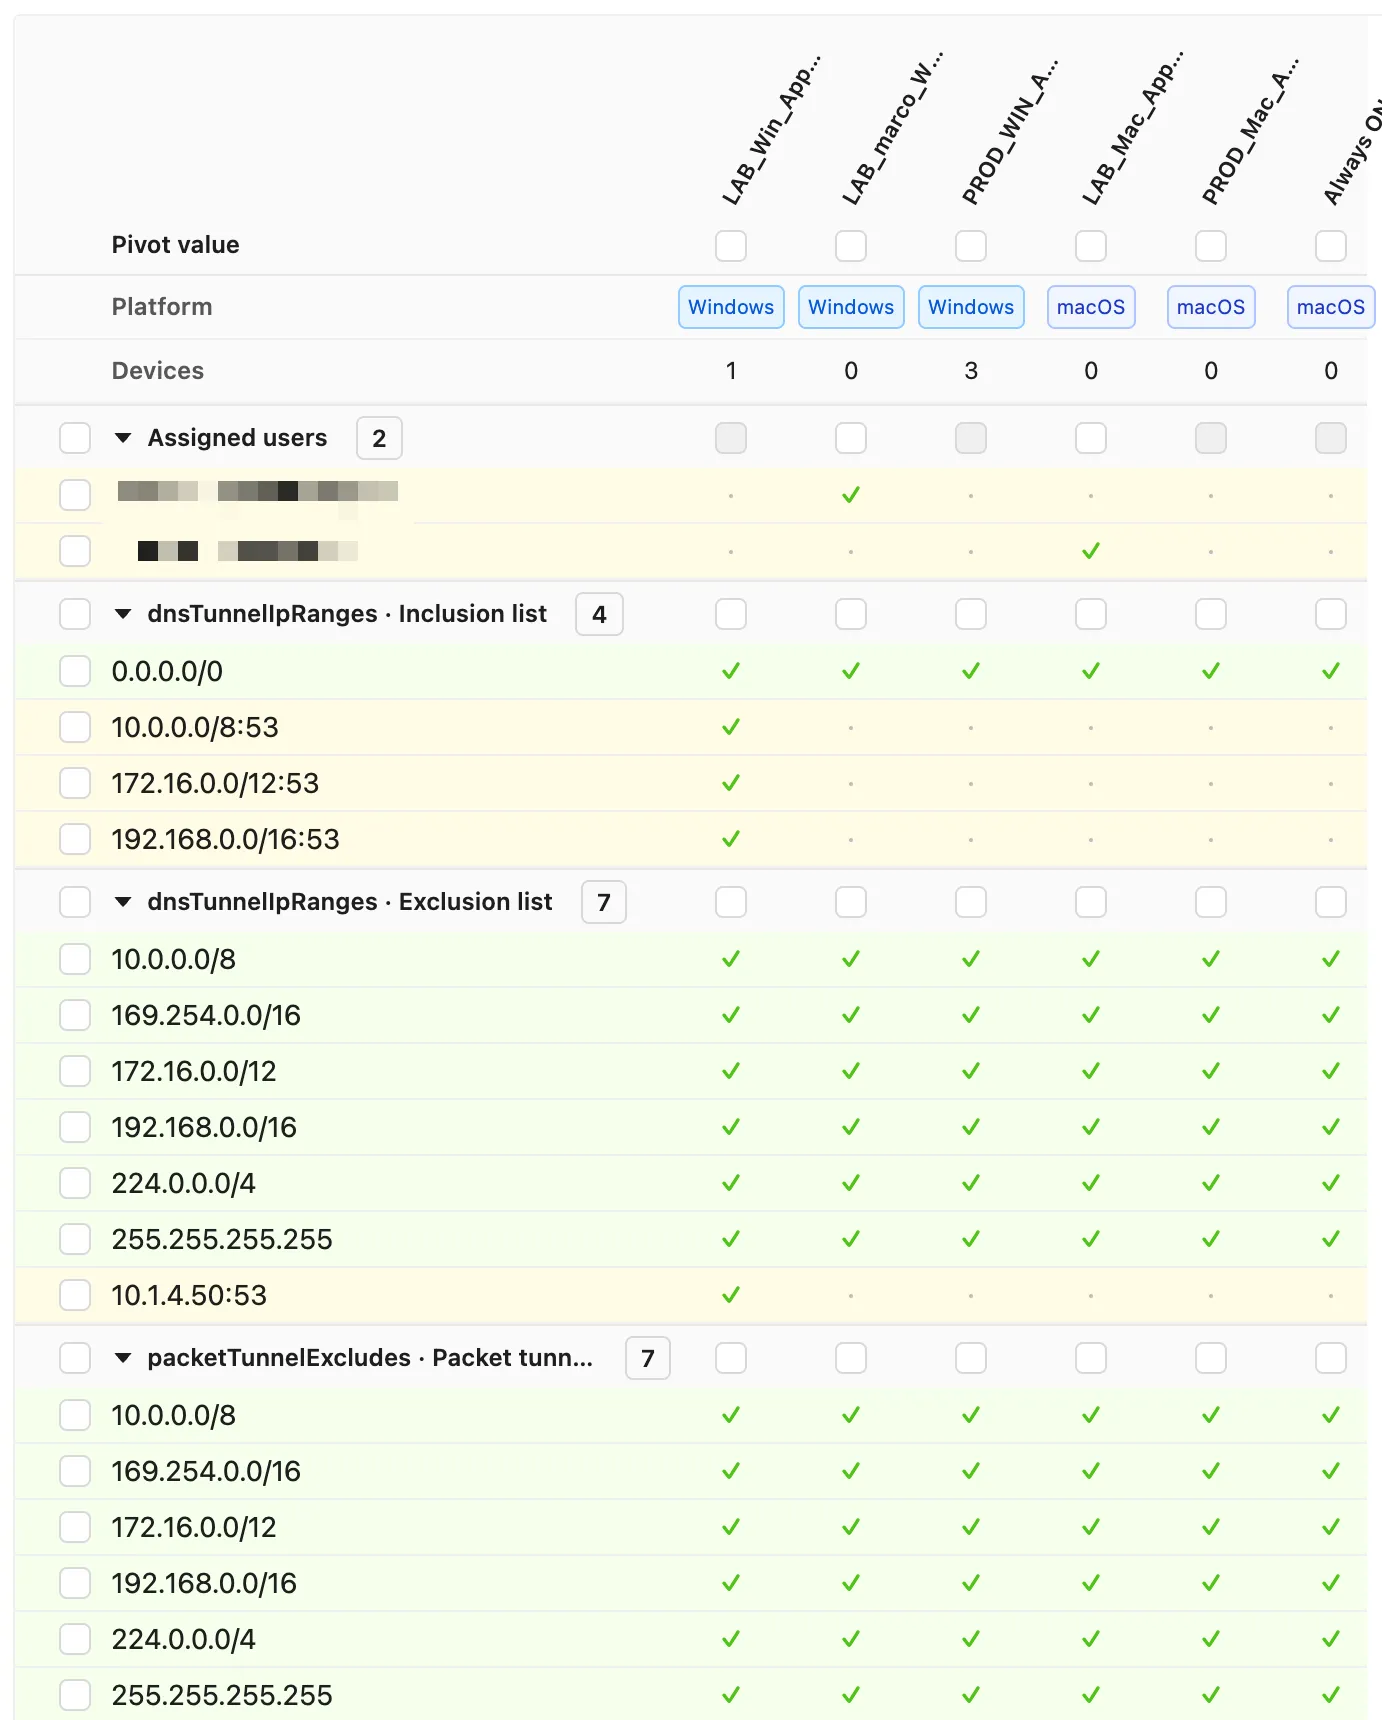
Rows that differ are easy to spot, selection checkboxes let you focus on specific sections, and a raw JSON diff exposes the exact configuration drift when you need it. This is what turns an M&A tenant merge or a pre-migration audit from weeks of guesswork into a deterministic comparison.
Compare PAC
The Compare PAC view applies the same pivot mechanics to PAC files, with built-in pattern recognition that flags the constructs worth auditing:
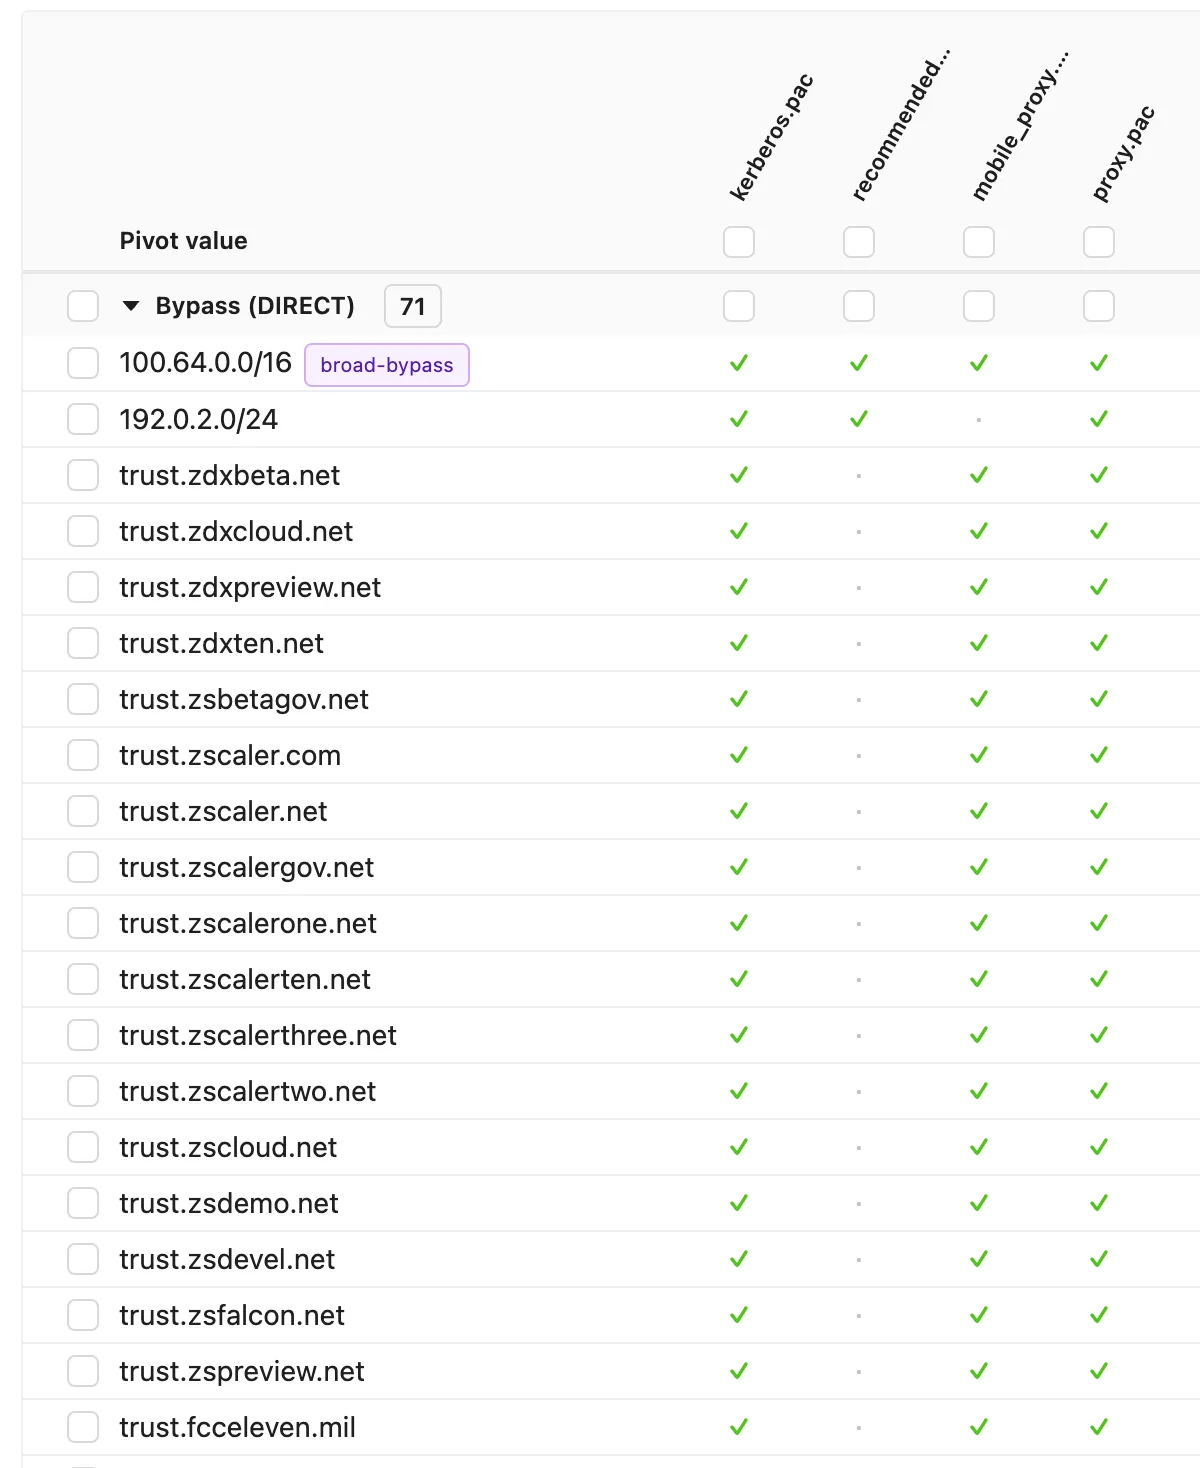
The Bypass (DIRECT) section lists what each PAC sends straight out, and tags like broad-bypass call out subnets that are wider than they should be, the kind of quiet exclusion that leaves traffic outside inspection without anyone deciding it should.
Remediation: from score to a prioritized plan
The Remediation tab converts the findings into a prioritized action plan and shows, with a Score Recovery Waterfall, exactly how much each fix would raise the fleet score:
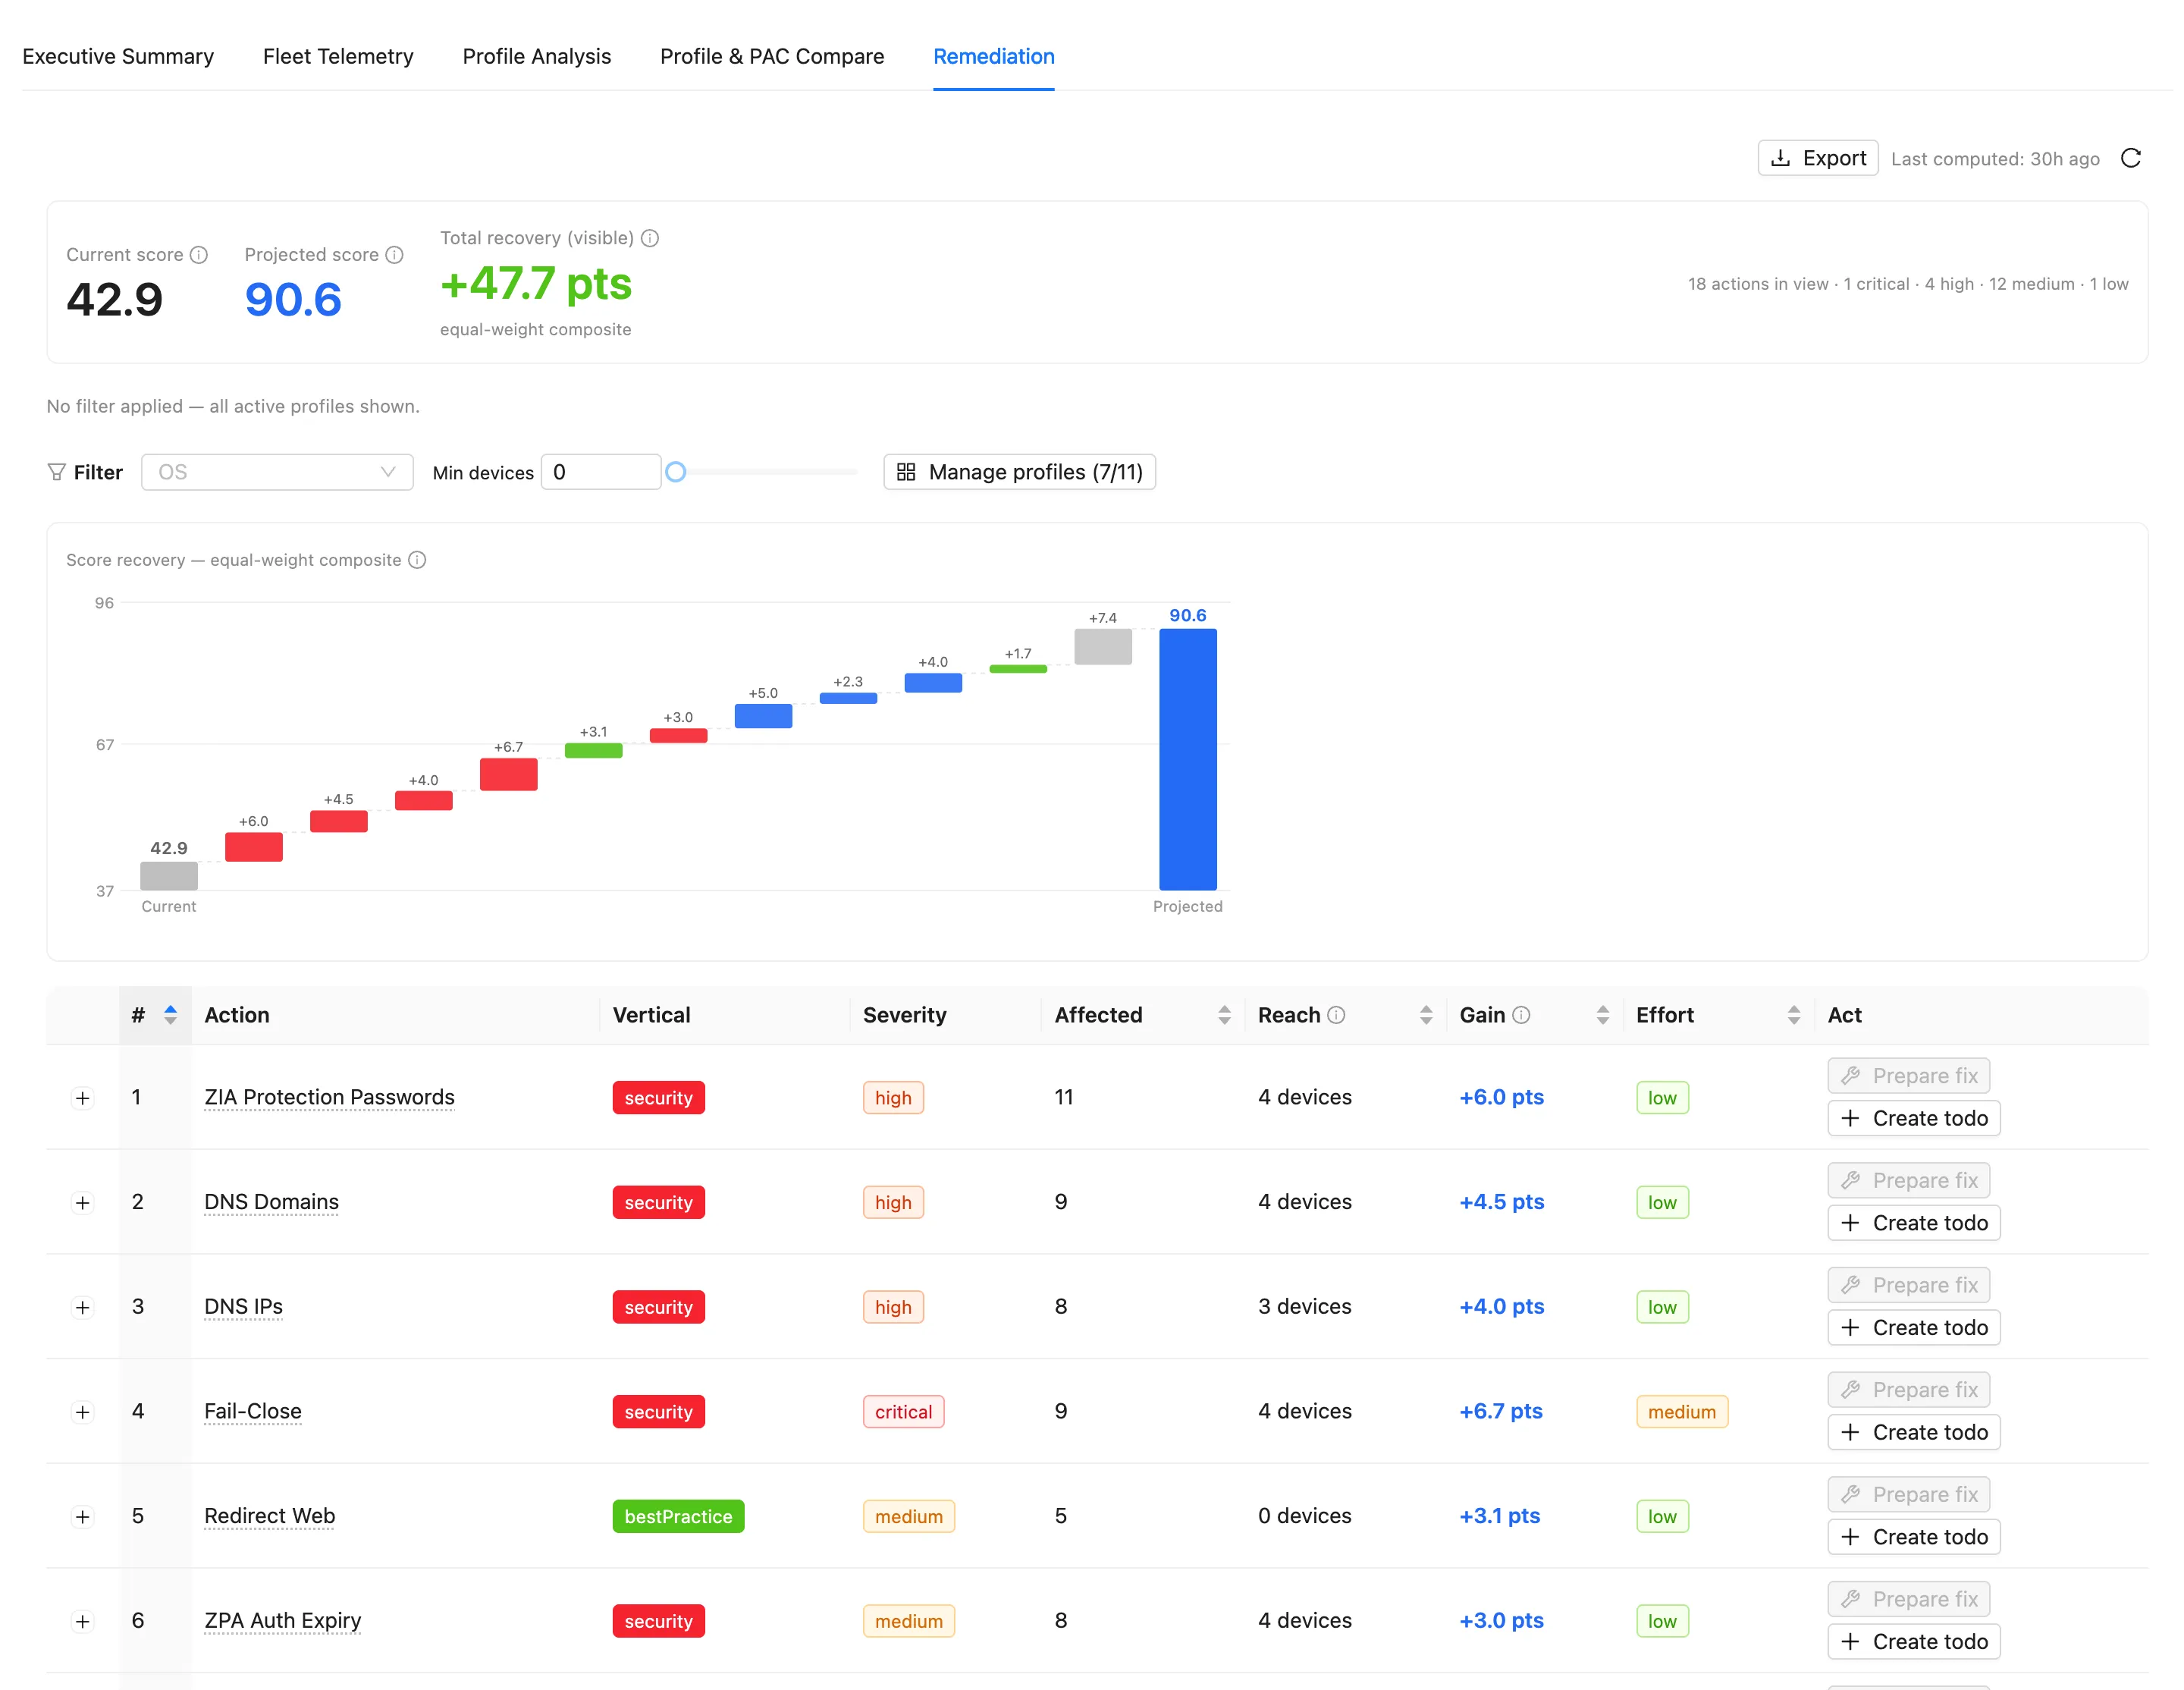
Each action carries its vertical, severity, the number of affected profiles and devices it reaches, the score gain it would recover, and an effort estimate, so you can sequence the work worst-first, or highest-return-first. From any action you can:
- Create to-do: turn the finding into a tracked, assignable Shared To-Do List item, linked to the affected profile
For ZCC actions the change itself is applied in the Zscaler console: ZHERO ranks the work and tells you what it is worth, and Create to-do is what carries it to completion.
The waterfall makes the business case concrete: instead of “the fleet is at a C”, you can say “these five changes move us from 42.9 to 90.6”, export the plan to Excel, and track it to completion.
What good and bad look like
Strong ZCC configurations are almost always the ones deployed cleanly from the start by someone who knew the platform. On tenants that have passed through several partners and internal teams over the years, the fleet quietly accumulates weaknesses that have real security weight: too many exclusions in PAC files, too many VPN gateways, ZIA that users can disable without it turning back on, DNS traffic that is not routed to private-IP DNS for the domains that need it, and missing resilience or disaster-recovery settings. None of these announces itself in the console. A fleet score, a coverage heatmap and a remediation plan are how they finally become visible, and fixable.
Related Features
- Security Posture Dashboard: the tenant-level ZIA and ZPA posture score, with history and per-finding attribution
- Shared To-Do Lists: where remediation findings become tracked, assignable work
- Change Management: stage and review fixes before they reach the tenant
Next Steps
- Open ZCC Fleet Health in the Experience Center and run an assessment
- Read the two scores together: the gap between Equal weight and Weighted by devices is your first insight
- Check Fleet Telemetry for Live Blind Spots and inactive services
- Use the Coverage Heatmap worst-first, then work the Remediation waterfall by score return