Security Posture Dashboard
The Security Posture Dashboard turns everything ZHERO finds in your tenant into one number you can track, defend and act on. It is for the person who has to answer “is our Zscaler configuration getting better or worse, and how do you know”.
When to use it
- Weekly or monthly hygiene: read the score, work the top of the Improve plan, move on.
- Before and after a change window: check the projected score before you execute a queue, and the trend afterwards to confirm the change landed the way you expected.
- When the score drops: use Trends and the attribution drawer to name the change, the template and the admin behind it.
- Board and audit reporting: a rising line with a per-event breakdown is evidence, where a point-in-time assessment is an opinion.
Where to find it in the UI
Open the ZHERO menu in the Zscaler console, click the Dashboards button, and select the Posture Insights tab. The tab carries a BETA badge in the console. It is available on ZIA, ZPA and Experience Center tenants; the ZIA / ZPA split appears wherever the tenant carries both planes.
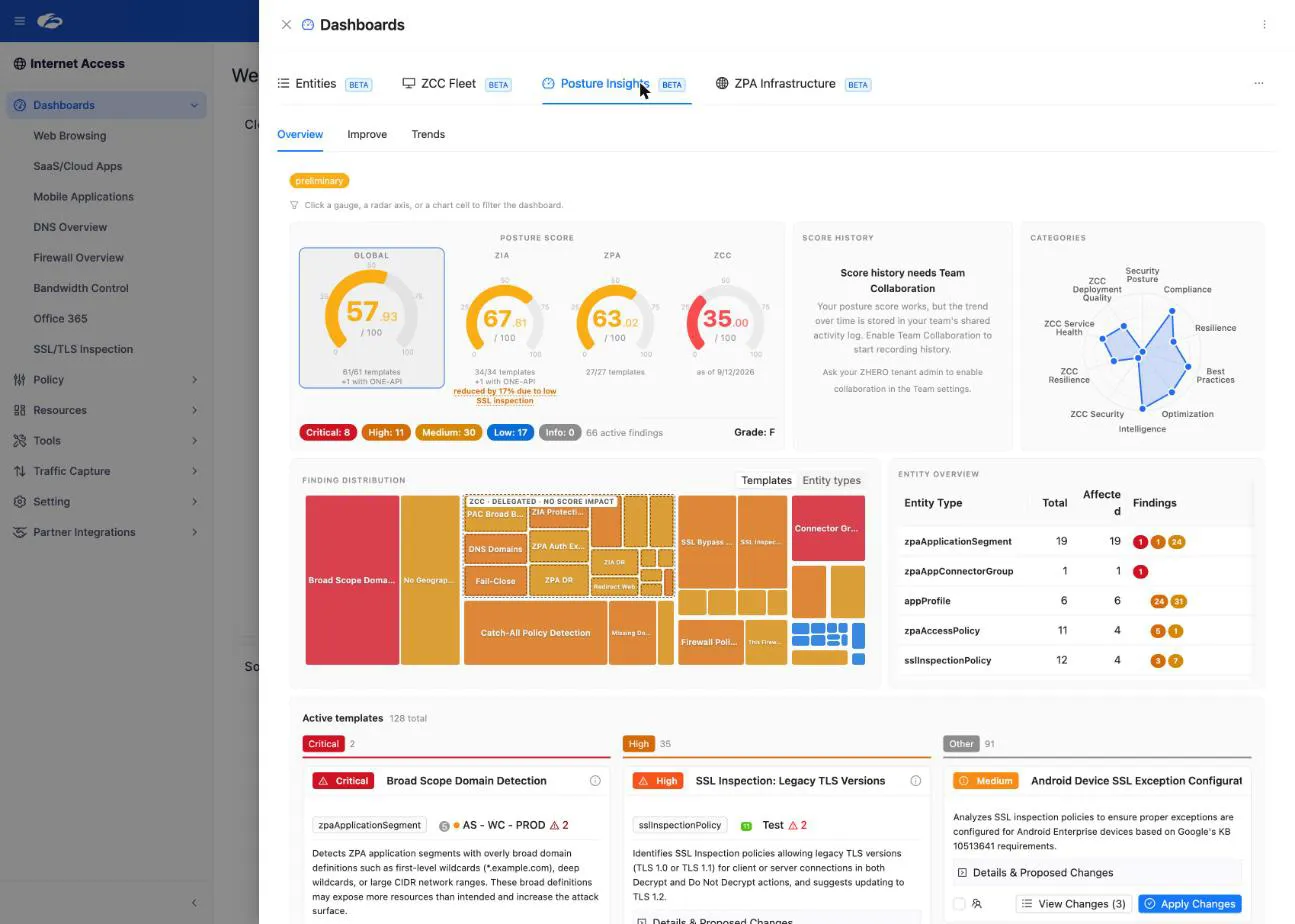
Inside the tab there are three sub-tabs, in this order:
| Sub-tab | What it answers |
|---|---|
| Overview | Where do we stand right now, and what is dragging the number down |
| Improve | What do we fix first, and how many points does each fix return |
| Trends | How did we get here, what moved the score and who moved it |
Overview: the score and what it is made of
The Overview opens on the gauge row: a Global score plus a gauge per product (ZIA, ZPA and, on Experience Center tenants, ZCC), each out of 100, with the grade and the active-finding count by severity underneath.
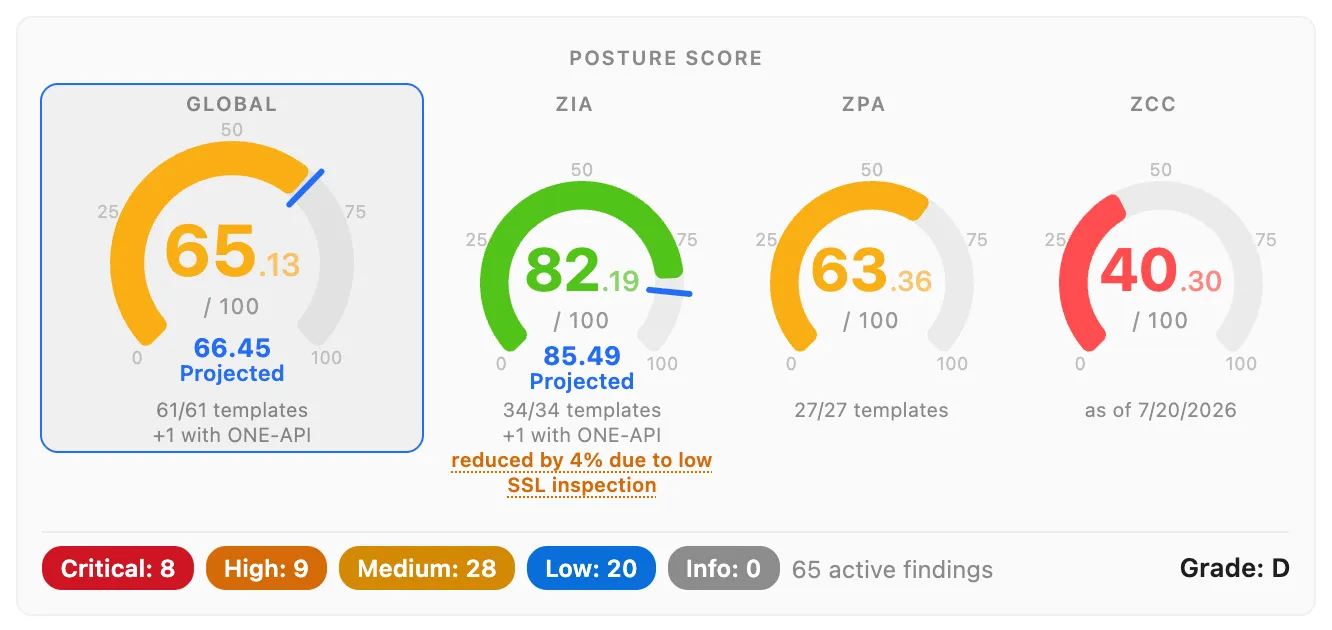
Read the row from left to right:
- Global is the composite. Each product contributes its share, and the ZIA contribution is gated by a foundational SSL inspection check: when the inspection rate is low, the caption says so explicitly (in the screenshot above, “reduced by 4% due to low SSL inspection”). A tenant that inspects almost nothing cannot buy a high score with good hygiene elsewhere.
- Per-product scores are computed independently, so a strong ZIA estate does not hide a weak ZPA one. This is the split that a single blended number always conceals.
- The coverage caption under each gauge (“34/34 templates”, “+1 with ONE-API”) tells you how much of the assessable surface was actually assessed. Always read the score together with its coverage: a high score on a third of the templates is not the same claim.
- The severity chips count the active findings behind the number, and the projected value in blue is the score your staged pending changes would produce (see below).
Below the gauges, the Overview carries the category bars, the findings treemap and the entity-severity matrix. They are cross-filtered: click a category, a treemap block or a severity, and the other views narrow to the same slice. This is how you get from “the score is 65” to “three templates on firewall rules are most of the gap” without leaving the tab.
Transparent scoring
Every finding’s contribution is exposed, per template. Two rules keep the number honest:
- Capped per template. A single template cannot dominate the score, however many entities it matches. Families of related checks (for instance every “unreachable policy assignments” variant) share one cap between them rather than one cap each.
- Hygiene is not exposure. The unreachable families score as low-impact hygiene. The templates that describe real exposure, such as a catch-all ZPA access policy, carry the weight.
Improve: the plan, not the list
The Improve sub-tab ranks what to fix by how many points it actually returns, computing the plan cumulatively: each step is recalculated against the state left by the steps above it, so the totals add up to something you can commit to instead of an inflated “points recoverable” figure.
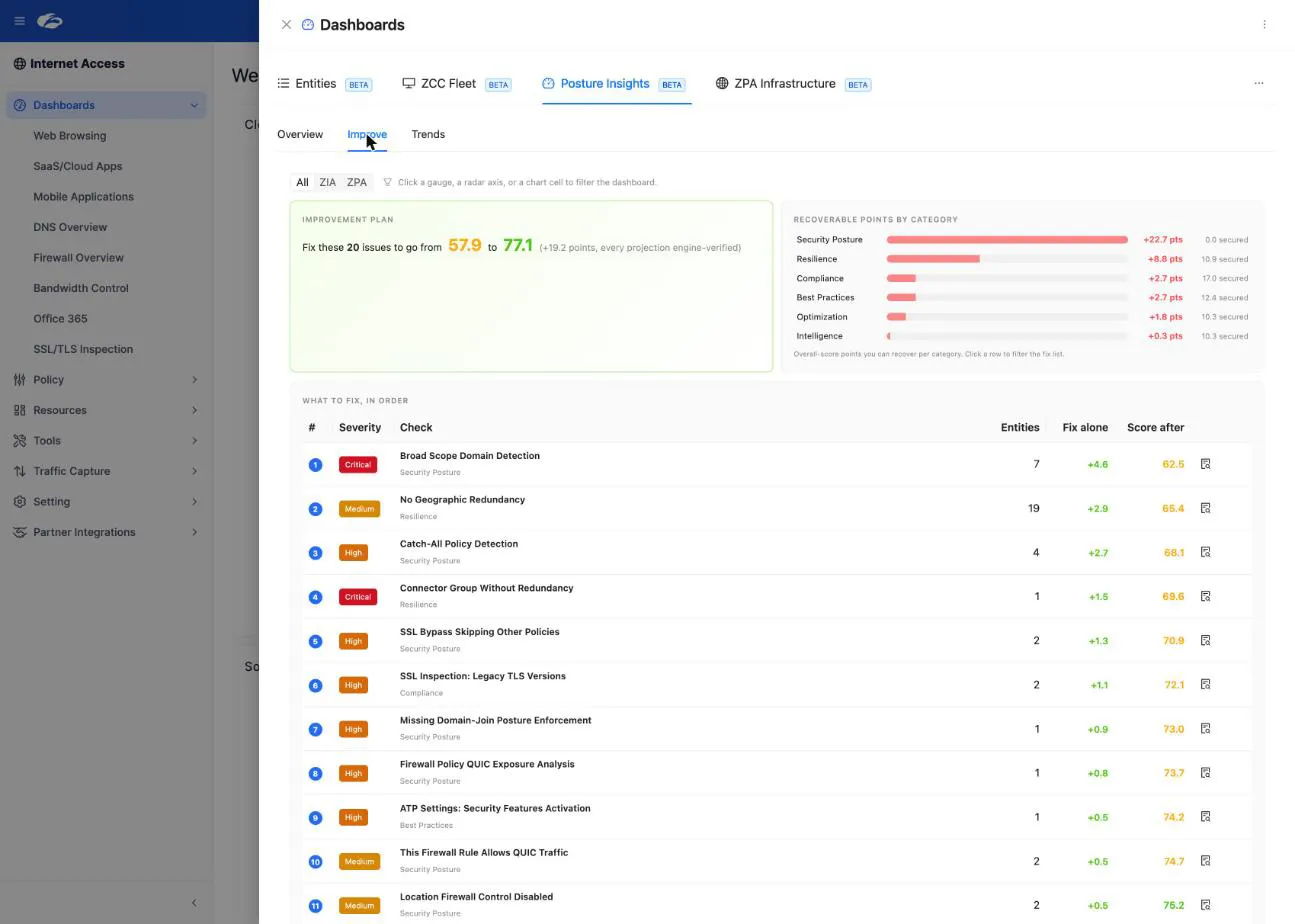
Work it top-down. Each row carries the template, the affected entities and the score gain, and where the template ships an automatic fix you can stage the remediation straight into pending changes from the finding, or turn it into a tracked shared to-do.
Trends: the history and why it moved
The Trends sub-tab is a candlestick chart of the score over time, with ZIA and ZPA tracked separately, zoomable by hour or day and rendered in your browser’s local timezone.
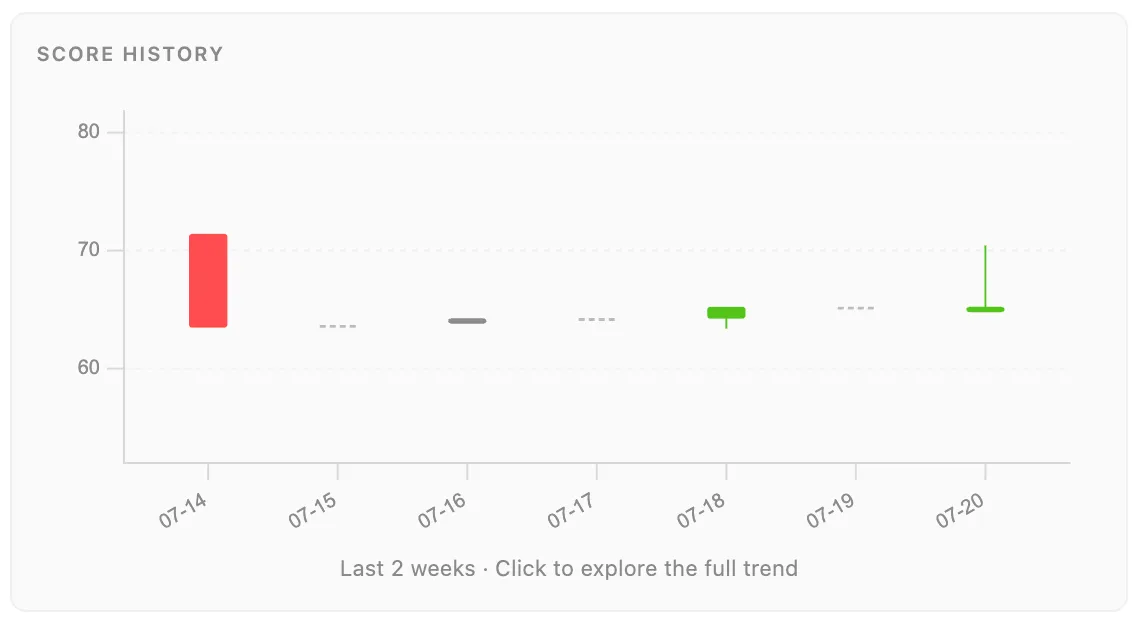
Days where the score did not move render as flat marks, and days with no data render as gaps: the series is deliberately sparse rather than interpolated, so you are never reading a synthetic point as if it were a measurement.
Below the chart, the events table lists every score-change event. Open one and the inspect drawer shows:
- the template impact chips: which checks moved the number, and by how much
- the cause: the configuration change the movement was attributed to, reconciled against the Zscaler audit log
- a deep link to the exact audit-log entry, which is where the admin account behind the change appears
Attribution works against a rolling 30-day audit horizon.
The score-drop safety net
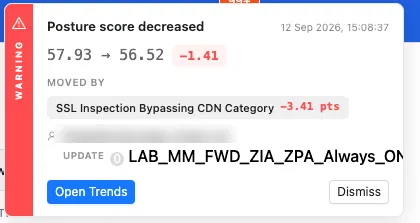
A drop does not wait for you to open the dashboard. ZHERO raises a sticky alert in the console with the before and after, the delta, the templates that moved it, and the change it was attributed to:
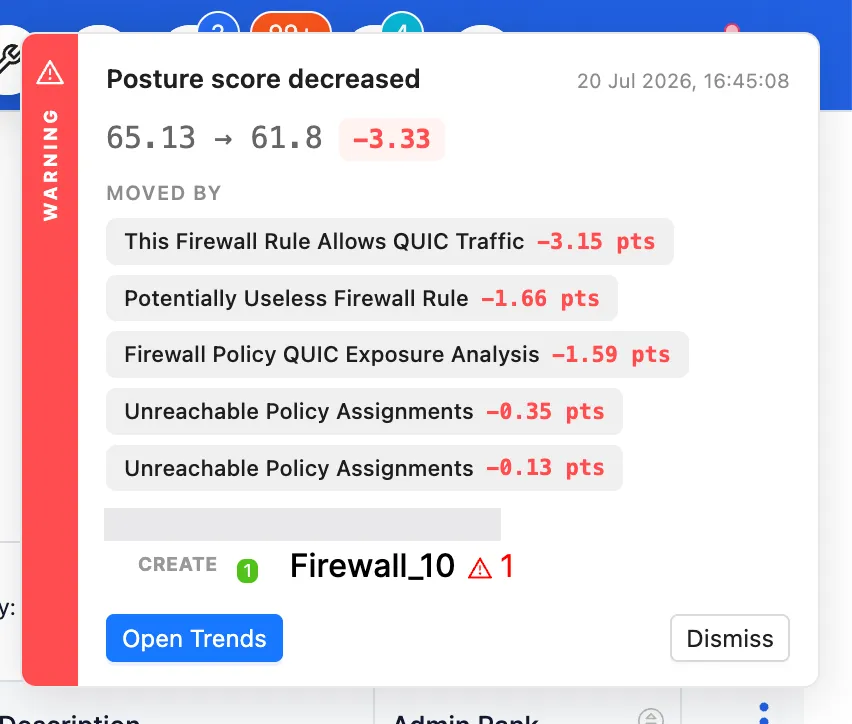
Open Trends takes you to the event. Dismiss clears the alert for the current cycle.
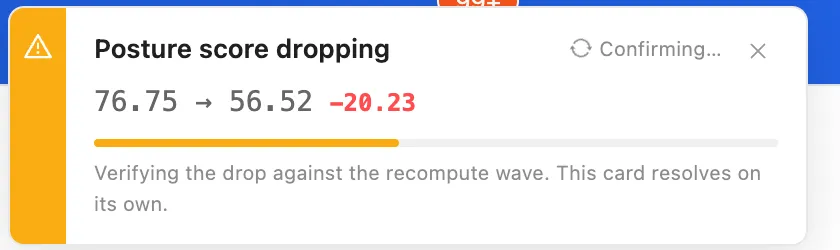
An alert can appear first in a Confirming state, with the card reading “Verifying the drop against the recompute wave”. ZHERO has seen the movement but has not committed to it yet, and the card resolves on its own. A transient dip during a recompute therefore does not reach you as a false alarm.
Projected score: the impact before you apply
When your pending-changes queue holds at least one change that a scored template cares about, the gauges show a second, paler value: the score that queue would produce once executed. The same actual-to-projected pair appears in the pending-changes review, at the moment you decide whether to execute.
The rules worth knowing:
- The projection covers your personal queue plus the shared team queue as last synced, and only clean, executable items. Conflicted or errored items are excluded, because the projection promises only what execution would actually deliver.
- It is ephemeral. Staging changes never moves the persisted score, never writes history and never emits a score event. Discard the queue and the projection disappears.
- A template flip list explains it: which findings the queue resolves, which it would activate, and which change their affected-entity count. Read it before a large mass edit: a bulk change that lowers the projection is telling you something before it costs you anything.
- Expensive analyses arrive progressively. The projection publishes without them and updates when they land, marking what is still being computed rather than quietly leaving it out.
Limits and notes
- The tab is labelled BETA in the console.
- Attribution needs the audit log. Events older than the rolling 30-day horizon cannot be attributed, and a score movement whose cause is not in the audit log is shown without one rather than guessed at.
- Coverage moves the score. Connecting OneAPI makes additional templates executable, which changes both what is assessed and the number itself. A jump right after configuring OneAPI is usually coverage, not a real posture change.
- ZCC contributes on Experience Center tenants only, and only once a ZCC Fleet Health assessment has run. Until then the ZCC gauge invites you to run one.
- Preliminary badge. While the first analysis pass of a session is still running, the score is marked as preliminary. Let it settle before quoting it.
- The score is computed from your tenant’s own configuration. It is not a benchmark against other organizations, and it is not a Zscaler-published metric.
FAQ
Why is my Global score lower than both my ZIA and ZPA scores? Because the Global score is gated by the foundational SSL inspection check. If inspection coverage is low, the ZIA contribution is scaled down, and the caption under the Global gauge names the reduction. Raising inspection coverage lifts the Global number more than any single finding will.
The score changed but nobody on the team touched anything. What happened? Two common causes. Either the assessed surface changed (a new template shipped, or OneAPI came online and unlocked checks), which the events table classifies as a ZHERO-side update rather than a configuration change; or somebody changed the tenant directly in the Zscaler console. The unified audit timeline is where the second case becomes visible.
Does staging a pending change affect my real score or its history? No. Staged changes only ever produce the projected value. The persisted score, the history and the score events always reflect actual tenant state.
How far back does the trend go? The chart holds the score history ZHERO has recorded for your tenant, written at most once per tenant per day plus one entry per score-change event. Attribution against the Zscaler audit log covers a rolling 30-day window.
Why do some findings show no score impact? Informational findings are score-neutral by design: they are guidance, not exposure. They appear in the findings views but contribute zero points, so they never inflate a remediation plan.
Related pages
- ZCC Fleet Health: the device-fleet score that feeds the ZCC gauge on Experience Center tenants
- Analysis Engine: where the findings behind the score come from
- Pending Changes: the queue that drives the projected score
- Shared To-Do Lists: turning a finding into tracked work
- Unified Audit Timeline: the audit data behind attribution
Next steps
- Open Dashboards, Posture Insights, and read the Global gauge together with its coverage caption
- Cross-filter the Overview to find the two or three templates carrying most of the gap
- Work the Improve plan top-down, staging fixes rather than applying them one by one
- Check the projected score before you execute the queue, and the Trends event afterwards