Analysis Engine
The Analysis Engine reads your Zscaler configuration and tells you what is wrong with it, in priority order, with the fix attached where a fix can be generated. It runs continuously in the background and, on the policy screens, as you type.
It is for the admin who knows the console will happily let them build something dangerous and would rather find out before the change is live than six months later.
When to use it
- Right after installing ZHERO, on the configuration you inherited. The first run on a tenant that has been through several owners is usually the most productive hour of the month.
- While you configure, on ZIA policy screens: the warning counter moves as you edit, before you click Activate.
- Before an audit, to clear the findings that an auditor would raise anyway.
- As the input to the score: every finding here is what the Security Posture Dashboard turns into a number.
Where to find it in the UI
Hover the ZHERO icon in the Zscaler console and click the Analysis Engine button (lightbulb icon). The drawer is titled ZHERO Analysis Engine and its button carries a badge counting the open critical, high and medium findings, so you can see the state of the tenant without opening anything.
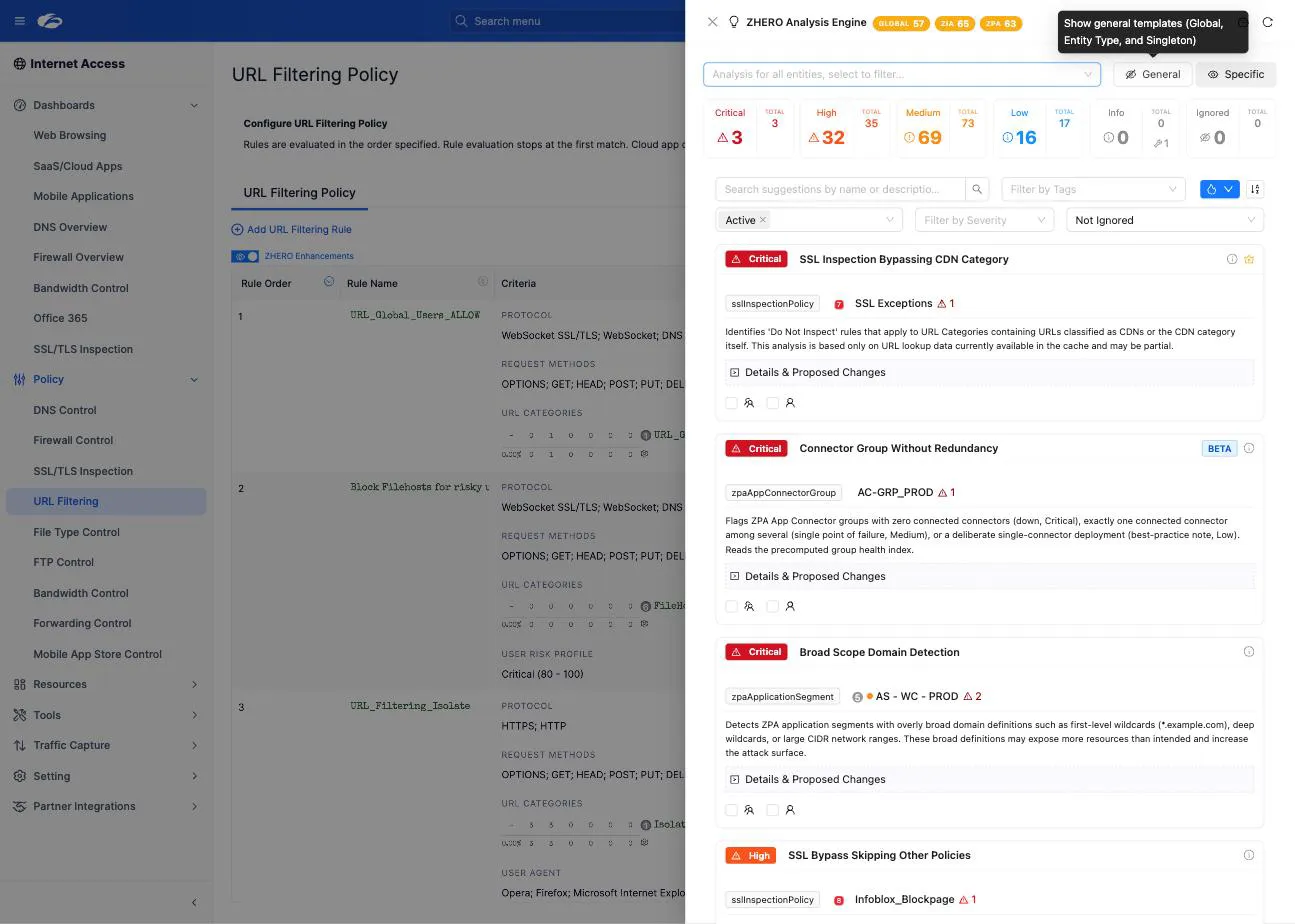
Findings also appear where the entities live: on the entity card, in the drill-down drawer, and as counters on the policy screens.
Step by step
- Open the drawer. It lists the findings for the whole tenant. The header carries the current posture score badges (Global, and per product on multi-plane tenants), with a button to jump straight to the dashboard.
- Filter by severity. The severity boxes across the top (Critical, High, Medium, Low, Info, plus Ignored) are both counters and filters. Click one to narrow the list, click again to clear. Each box shows the count for the current filter and the count for the whole tenant.
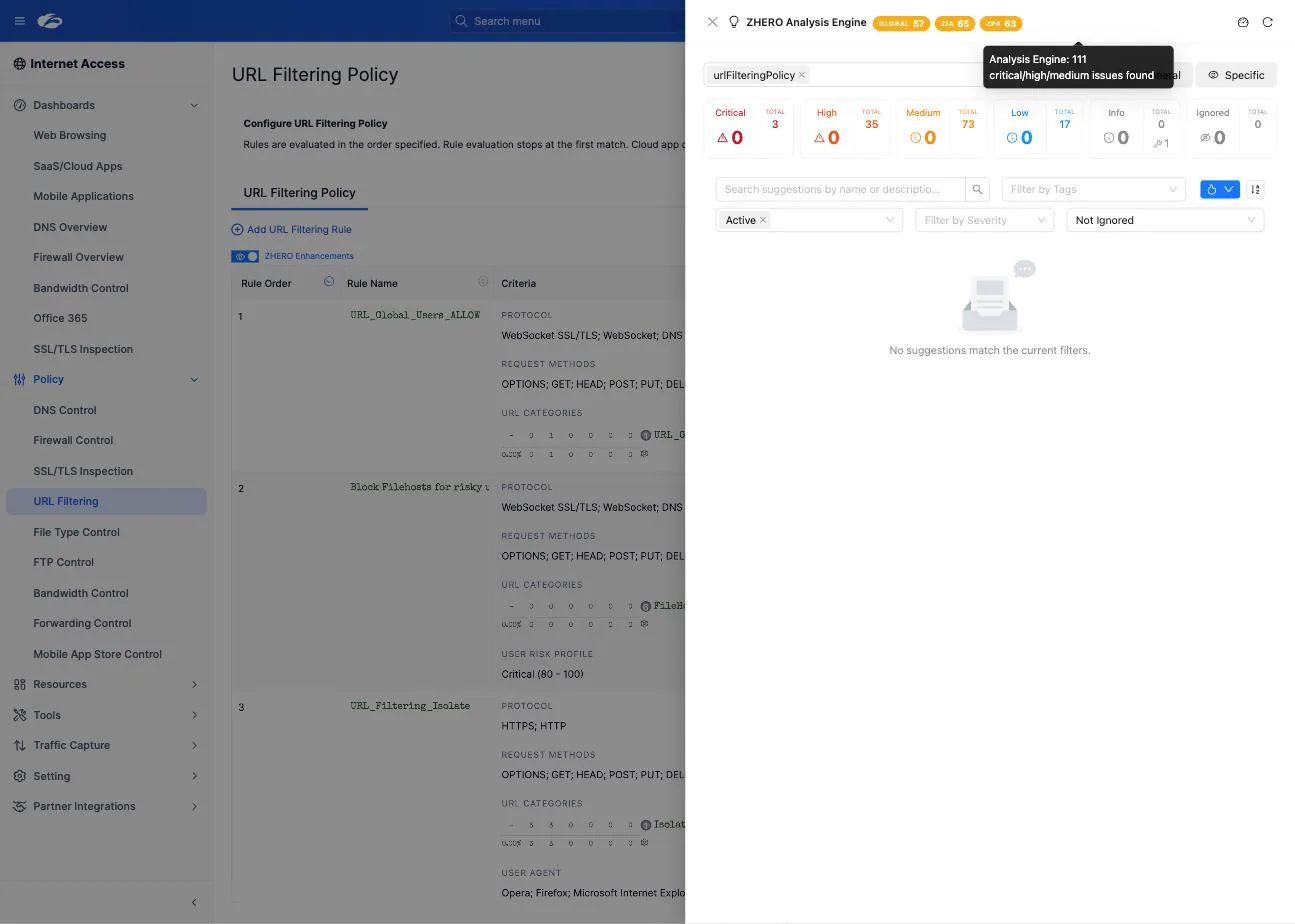
- Narrow by scope. The context selector filters to a specific entity, and two toggles switch between general templates (tenant-wide and entity-type analyses) and entity-specific templates (one finding per affected object).
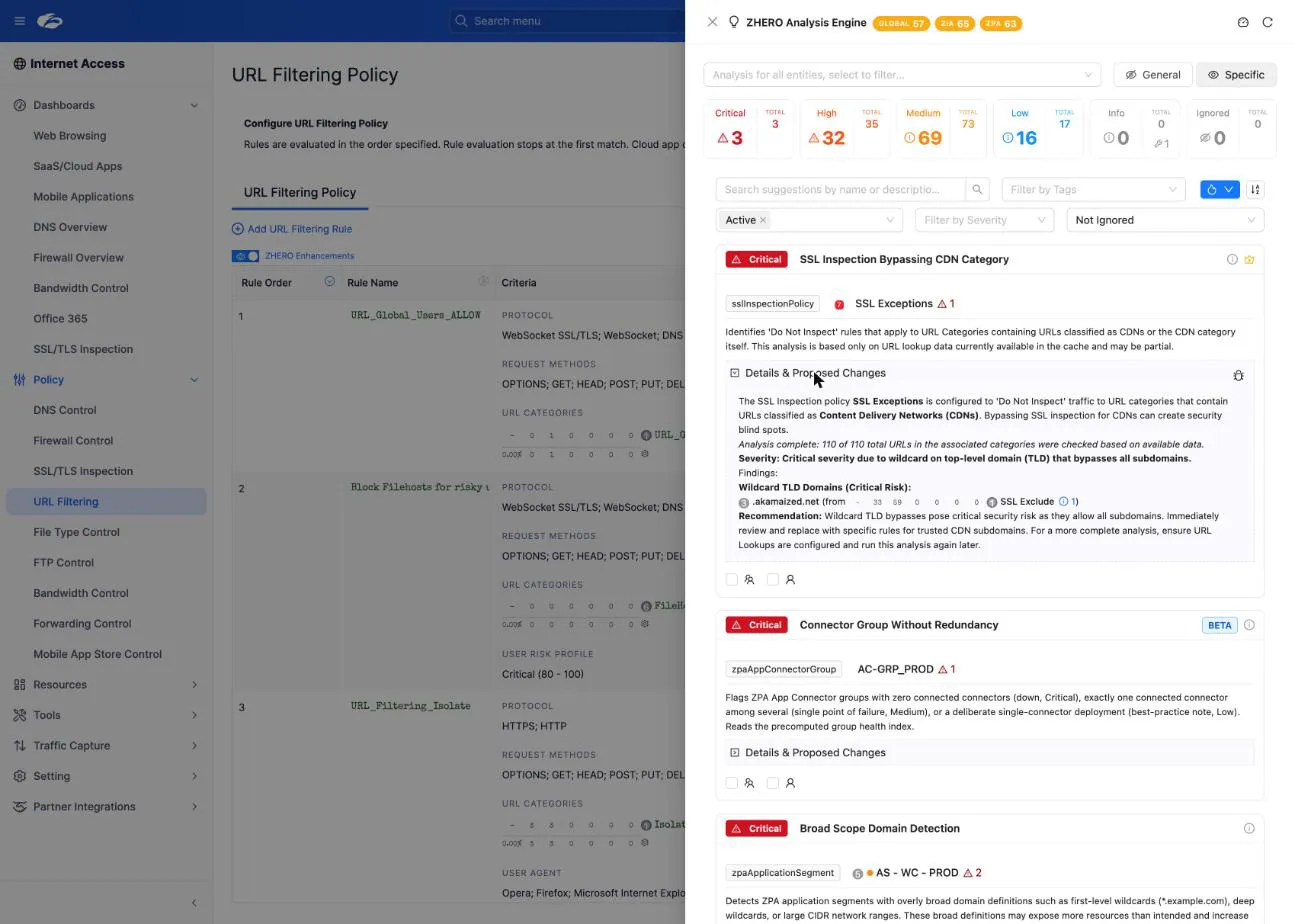
- Read a finding. Each one explains what was detected, why it matters, and which entities it affects. Click through to the entity to see it in context.
- Act. Where the template ships an automatic fix, the finding carries View Changes (n) and Apply Changes. The first opens the Proposed Changes modal, which shows the entity as it will be with the changed fields highlighted. The second does not write to the tenant: it stages the change in Pending Changes with the source finding attached, so the reviewer sees why the change exists. Where the template ships no fix, the finding tells you what to change in the console.
- Or park it. Ignore a finding you have consciously accepted. Ignored findings move to their own box, stay countable, and stop cluttering the working list.
How the engine works
Three levels of analysis
| Level | What it looks at | Example |
|---|---|---|
| Entity | One object at a time, producing one finding per affected object | A firewall rule that leaks QUIC |
| Entity type | The whole set of objects of one type, producing one aggregate finding | Whether the default firewall rule blocks |
| Global | The tenant as a whole | Tenant-wide roll-ups such as the App Connector fleet summary |
Severity
Every finding carries one of five severities. Severity is often computed rather than fixed: the same template can return High or Medium depending on how bad the instance actually is.
| Severity | Meaning |
|---|---|
| Critical | An exploitable gap or an outage waiting to happen |
| High | A significant risk that deserves the next change window |
| Medium | Worth fixing, not worth an emergency |
| Low | Hygiene and incremental improvement |
| Info | Guidance and context, never a defect |
Informational findings are score-neutral by design: they never add or remove points, so they cannot inflate a remediation plan.
Categories
Each template belongs to one category, which is what the posture score groups by: Security Posture, Optimization, Compliance, Best Practices, Intelligence and Resilience.
Costly analyses run on their own schedule
Some templates read 30 days of traffic logs or hit the Zscaler APIs hard. Those are queued and processed one at a time rather than all at once, with results arriving progressively. The drawer tells you when a costly analysis is still in the queue instead of showing you an empty result as if it were a clean one.
The real-time safety net
On ZIA policy screens, the analysis runs as you configure, before you click Activate. The warning counter is the tell: build a rule with a criterion you did not mean to leave wide open, and the counter jumps from a handful to hundreds because you have just shadowed every specific rule below it. You see the consequence while the change is still a draft.
On ZPA there is no activation step, so validation is continuous instead of pre-activation.
The same detection, applied to the configuration you already have, is what Unreachable Policy Detection surfaces.
What to watch
- The badge on the Analysis button. It counts critical, high and medium. If it climbs while you are editing, stop and read.
- The Ignored box. A tenant that ignores half its findings is telling you something, either about the findings or about the team.
- Templates that need OneAPI. A few analyses require OneAPI credentials to run at all. Until they are configured, those templates are simply not executed, and the coverage caption on the posture score says so.
Limits and notes
- ZHERO analyses configuration, plus traffic volumes where Zscaler exposes them. It is not an IDS and it does not inspect payloads.
- Findings are as good as your admin role. With a restricted Zscaler role, the objects you cannot read cannot be analysed, and ZHERO degrades quietly instead of reporting a false clean.
- Most findings have no automatic fix, and that is by design. A template proposes a change only where the problem has one clear solution. In many cases it does not: a connector group without redundancy or an over-broad application segment can be resolved in several legitimate ways, and the right one depends on your network, not on a rule. There, ZHERO puts the problem in evidence, explains it, and leaves the choice of fix to the administrator. The template set is a continuous work in progress: when a finding gains a clear solution, it gains a proposed change.
- Ignoring is a decision, not a deletion. Ignored findings stay in the tenant’s counts and stay visible to your team.
- A full tenant scan typically takes a few minutes. Real-time checks answer in under a second.
FAQ
How many templates are there? 86 in the current build: 34 named ZIA and ZPA analyses, 28 unreachable-policy and unreachable-assignment variants across the entity types that carry policy criteria, and 24 ZCC configuration checks. The full list, with severity and scope, is in the Analysis Templates catalog.
Does the engine change anything in my tenant on its own? No. It reads. Every fix it proposes has to be staged and then executed by a human through Pending Changes.
Why did a finding appear without anybody changing the configuration? Either a new template shipped, or a template that could not run before became executable (OneAPI came online, or a costly analysis finally reached the front of the queue). The posture dashboard’s events view distinguishes this from a real configuration change.
Can I disable a template I do not care about? Yes. Findings can be ignored individually, and templates can be ignored globally or for a specific policy, so a deliberate exception stops resurfacing every scan.
Do my configuration details leave the browser for analysis? No. The analysis runs locally in the extension. See Privacy and data for what does and does not reach ZHERO’s servers.
Related pages
- Analysis Templates catalog: every template, with severity and scope
- Unreachable Policy Detection: the dead-policy family in detail
- Security Posture Dashboard: the findings as a trackable score
- Pending Changes: where a suggested fix goes
- Shared To-Do Lists: a finding turned into assigned work
Next steps
- Open the Analysis Engine drawer and filter to Critical, then High
- Pick one finding with a suggested remediation and follow it through to the pending queue
- Watch the warning counter while you build a deliberately broad rule on a test policy, then discard it
- Check the catalog for the templates that need OneAPI, and decide whether to connect it