ZPA Diagnostics Engine
The native ZPA diagnostics page answers “show me the logs”. It does not answer “so who exactly is using this application segment, and what are they actually reaching”. ZHERO reads the same logs and enumerates the answer, live, then hands it to you as a spreadsheet.
It is for the admin who has been asked for a list, by the firewall team, by security, or by a migration plan.
When to use it
- Before tightening a segment: enumerate the domains and ports actually in use, so the tightening is based on traffic rather than assumption.
- Policy impact questions: who is matched by this access policy, in this window.
- Cross-team handoffs: the firewall team wants domain and port combinations; give them the export.
- Migration inventories: what is actually traversing the segments you are about to move.
Where to find it in the UI
Go to the ZPA Diagnostics page in the Zscaler console. ZHERO adds a button there, and it is aware of the filters you already applied on the page. The panel it opens is draggable and resizable, so it works alongside the native page rather than replacing it.
The engine can also be launched from an Access Policy, an Application Segment or a URL entity card, with the filter pre-populated from the entity you started on.
The feature is in Beta.
Step by step
-
Set your filters on the ZPA diagnostics page (a username, an application segment, a policy), then open the ZHERO panel. It reads them and shows them as the starting context. With no filters set, it says so and offers quick filters for application segment or policy.
-
Choose the time range in the panel, independently of the page: presets from 5 minutes to 14 days, or a custom start and end. Alongside it, an outcome filter narrows to Errors, Access Policy Blocks, Timeout Policy Blocks, Successful or Info.
-
Choose the tab: Raw Logs for the underlying entries with infinite scroll, Drilldown for the enumeration, History for what you have already run.
-
Pick a discovery type.
Discovery type What you get Users Every unique username whose traffic matched, with last known IP and request count Domains Every unique destination domain or IP, with the application it belongs to Domains + Ports The same, expandable per domain into TCP, UDP and ICMP ports with request counts 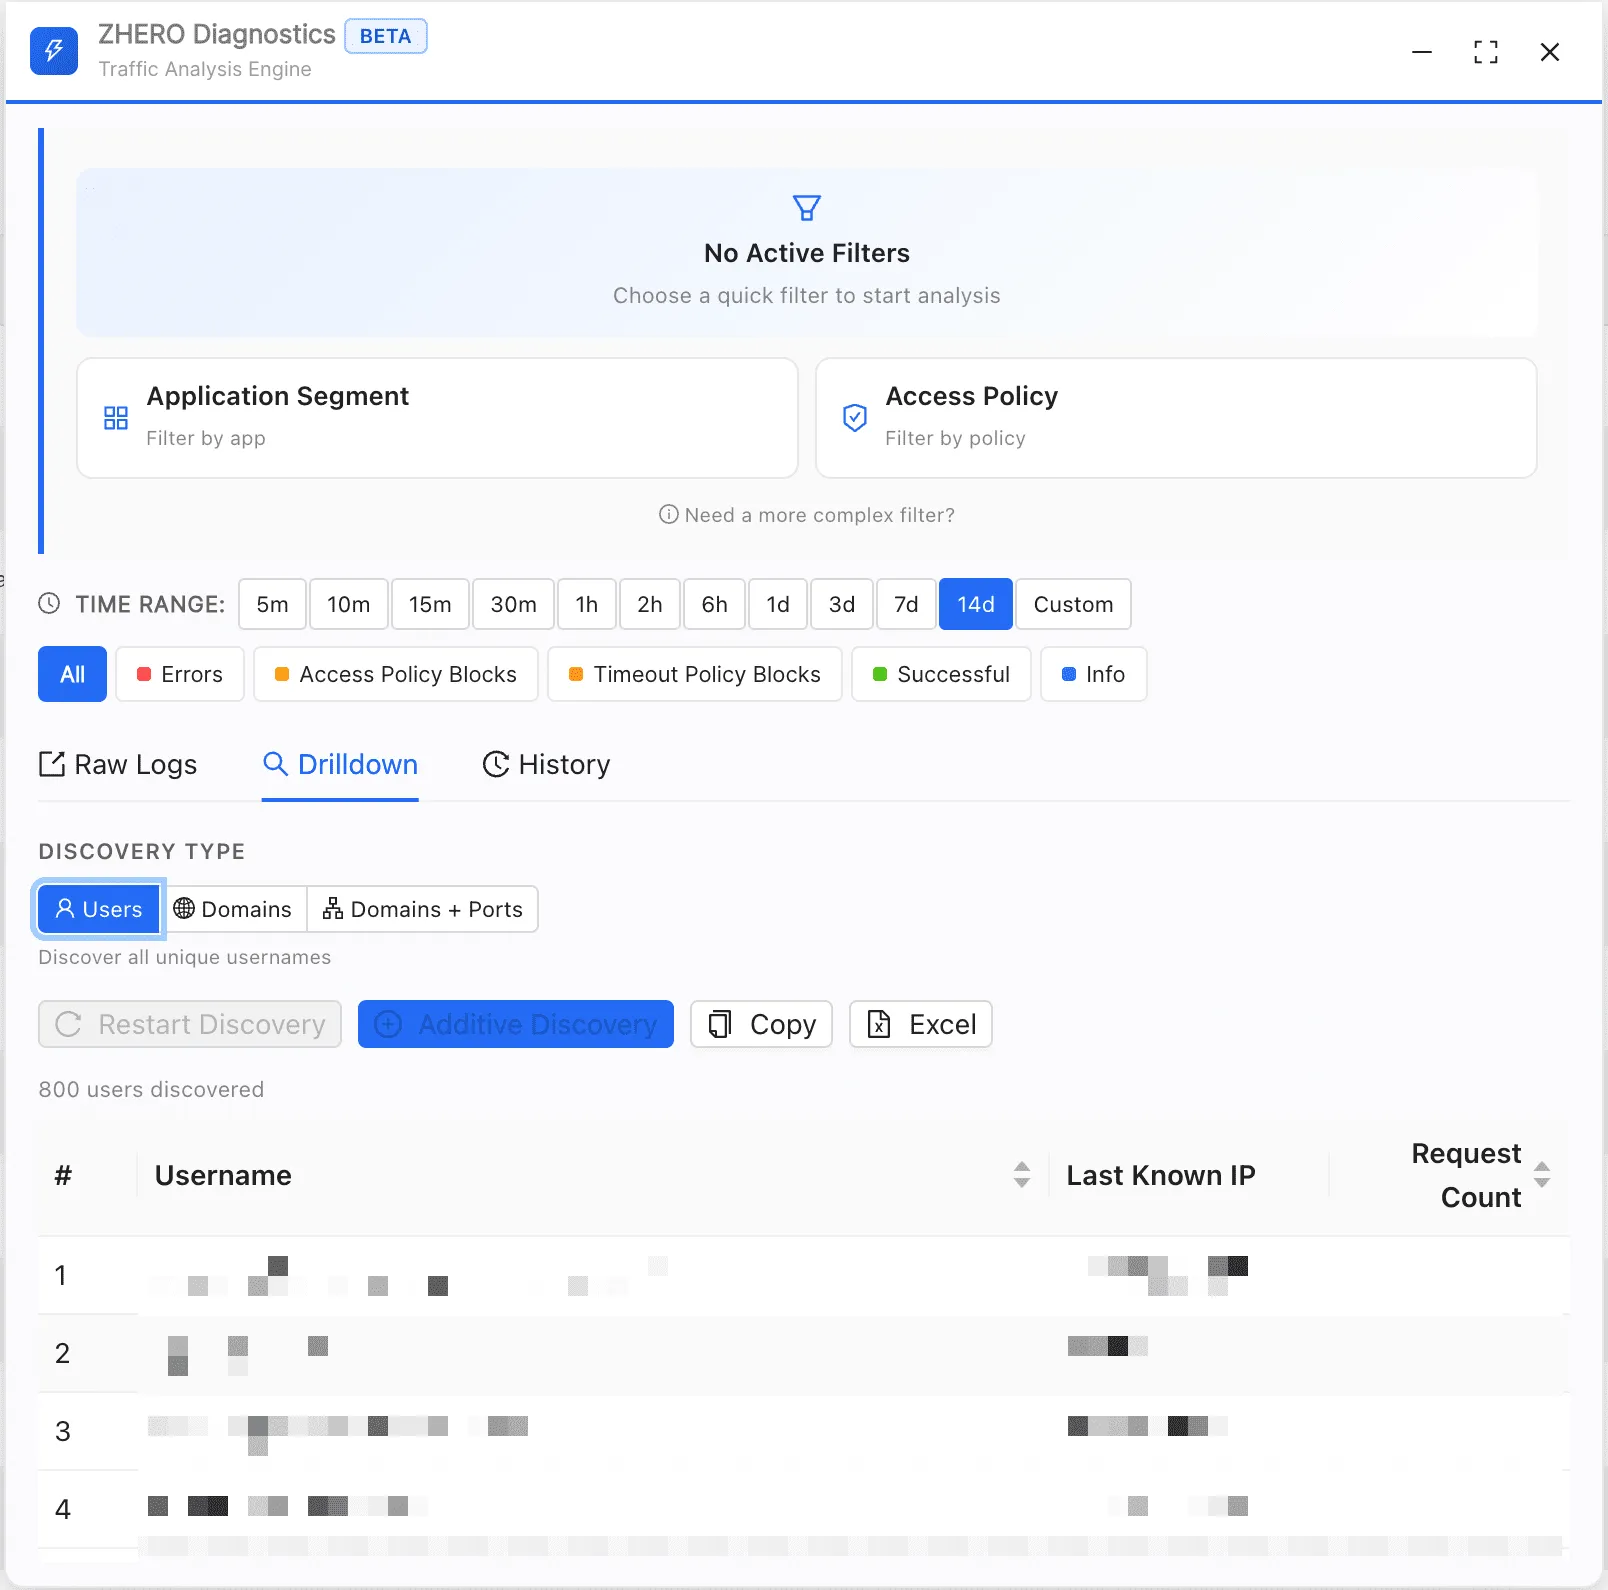
-
Watch it fill in. Results appear progressively as they are discovered, with a running count. You do not wait for the whole query to finish before seeing anything.
-
Keep working. Minimise the panel and the search continues in the background. You are notified when it completes.
-
Take the results. Copy puts them on the clipboard; Excel exports them. The domains-and-ports export carries domain or IP, application, application subnets and wildcards, TCP, UDP and ICMP ports, and the outcome breakdown: total requests, successful, info, blocked, timeout, errors.
Restart Discovery runs the enumeration again from scratch. Additive Discovery extends the result you already have instead of throwing it away, which is what you want when widening a window.
What to watch
- Domains that resolve to a raw IP are shown with both the name and the resolved server IP. Direct-to-IP access is worth a second look.
- The outcome columns. A domain with a high blocked or timeout share is a misconfiguration, not traffic.
- A short window first. Start with 30 minutes to confirm the filter is right, then re-run wider. A 14-day enumeration on a busy segment is a long query.
- The entity name, not the id. Results are enriched with human-readable entity names, so the export is readable by people who do not live in the ZPA console.
Search history
Drilldowns can be expensive, so results are cached. The History tab keeps your recent searches with their filters and timestamps, and you can reload one instead of re-running it. Pin the ones you want to keep, and refresh a cached result either completely (Restart Discovery) or additively (Additive Discovery) when you want to extend it.
Limits and notes
- The engine is Beta.
- The button only appears on the ZPA diagnostics page. From elsewhere, start from an entity card.
- Filters do not follow you live. If you change the filters on the page while the panel is open, reopen the panel to pick them up.
- The window is what you asked for. An enumeration is only complete for the time range selected; traffic outside it is not missing, it was never queried.
- This reads logs, it does not change anything. Acting on what you find happens through ZPA Domain Management or Mass Edit.
- Large enumerations take minutes. That is why they run in the background and why results are cached.
FAQ
Why not just export the raw logs and pivot them? That is the workflow this replaces. The drilldown does the unique-value aggregation for you, live, and produces a sheet with the outcome breakdown already per domain and port.
Can I run it without any filter? No. An unfiltered enumeration over a busy tenant is neither useful nor kind to the API. The panel asks you for a filter, and offers quick ones for application segment and policy.
What is the difference between this and the Troubleshooting Engine? The Troubleshooting Engine answers a ZIA question about one case: why this user cannot reach this destination. This answers a ZPA question about a population: everyone and everything behind a filter.
Do the results include blocked traffic? Yes, and the breakdown separates successful, info, blocked, timeout and errors, both on screen and in the export.
Can I close the browser while a search runs? You can close the panel. Closing the tab or the browser ends the search.
Related pages
- Troubleshooting Engine: the ZIA side
- ZPA Infrastructure Dashboard: the delivery chain behind these paths
- ZPA Domain Management: acting on what you find
- Export catalog: the other reports ZHERO produces
Next steps
- Open the ZPA diagnostics page, filter to one application segment, and run “Find all domains” with ports for the last hour
- Compare the result with how the segment is actually defined
- Widen the window to a week and export the sheet for the firewall team
- Pin the search so next month’s review starts from a baseline