Troubleshooting
If ZHERO misbehaves (data not loading, charts not appearing in the console, tables rendering oddly), the steps below resolve almost every issue you may encounter. They are ordered from least to most invasive: start at the top and stop as soon as the problem is gone.
Quick reference
| Symptom | Start from |
|---|---|
| A table renders partially, looks frozen or empty | Step 1 |
| Charts or data not loading, analysis templates or posture scoring look off | Step 2 |
| ZHERO shows a configuration that does not match what you see in Zscaler | Step 3 |
| Everything feels slow, and not only ZHERO | If the whole browser feels slow |
| Anything else, or the steps above did not help | Step 4 |
The troubleshooting ladder
-
Force a re-render. If the issue is visual and confined to a table, scroll up or down to force the rows to render again. Alternatively, switch to another tab or menu entry and come back: returning to the view re-renders it.
-
Refresh the page. ZHERO reinitializes most of its features on page load, so a browser refresh is a valid general-purpose fix. It typically resolves issues with analysis templates, posture scoring and rendering.
-
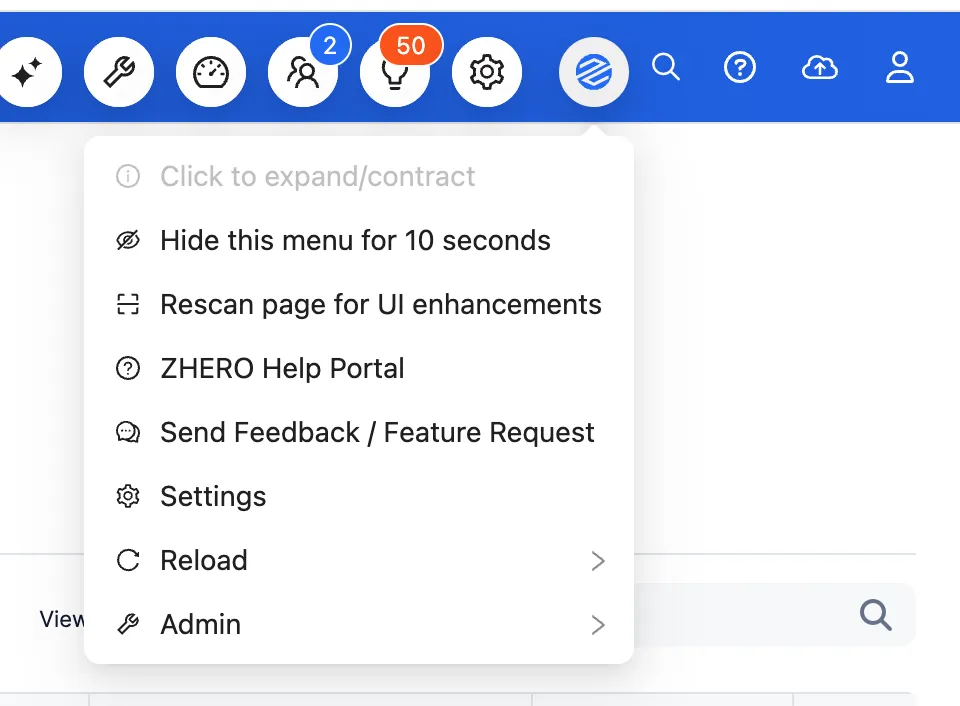
Reload specific entities. If ZHERO shows a configuration that differs from what you know is in Zscaler, some entities may need a reload. Hover over the ZHERO icon in the Zscaler console header and choose Reload: from there you can force a reload of specific entities.
-
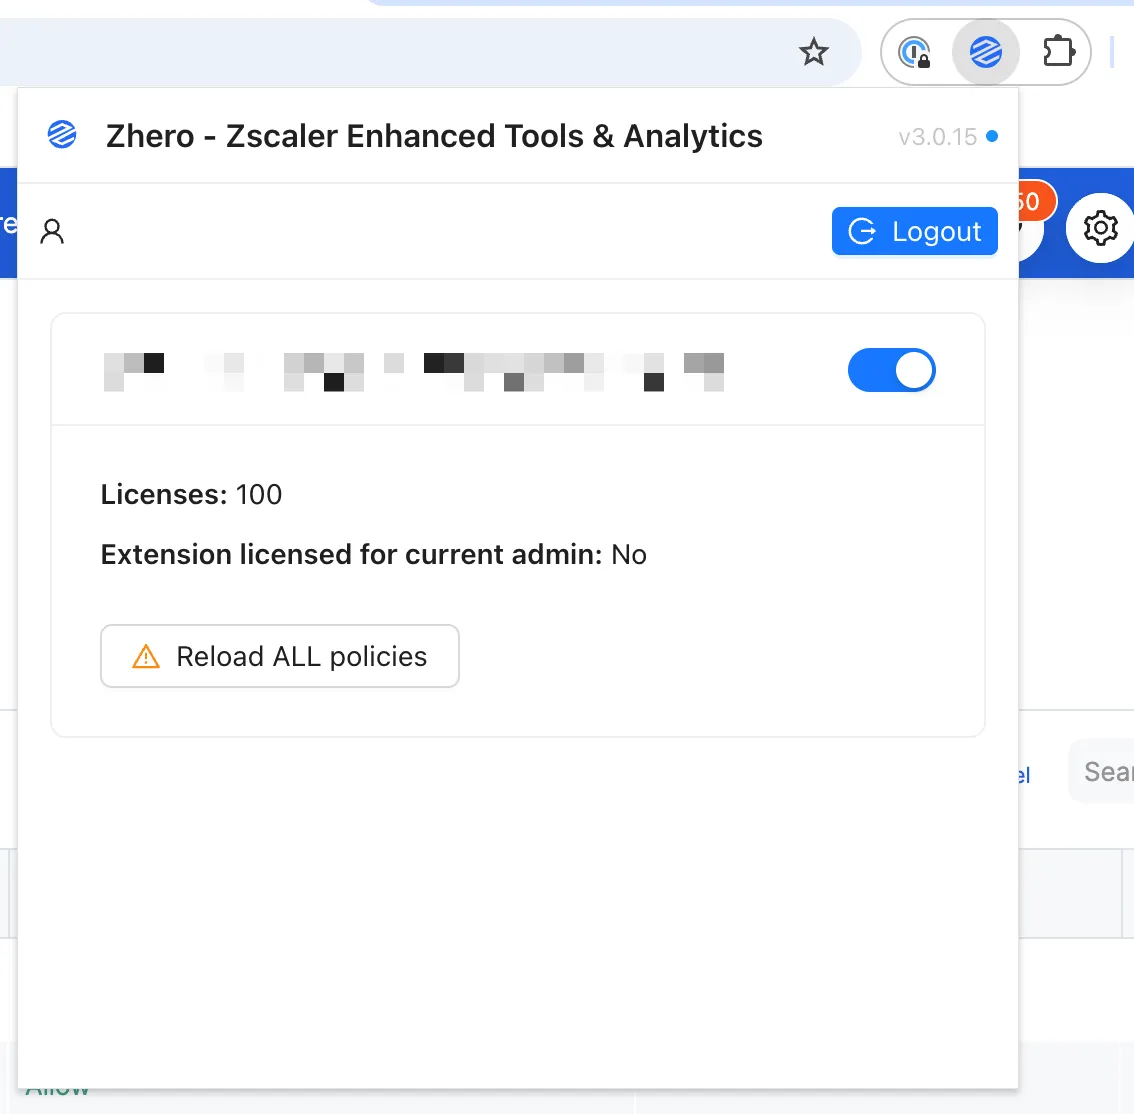
Reload ALL policies. Click the ZHERO extension icon in the browser toolbar and click Reload ALL policies. ZHERO reloads the console, clears its cache and reloads all the information from the Zscaler console. This resolves the large majority of remaining issues.
If you do not see the extension icon, open the browser’s extensions list and pin ZHERO so the icon stays visible.
-
Log out and log back in, using the Logout button in the same extension popup.
-
Reinstall the extension. As a last resort, remove the extension from the browser and install it again following the Installation Guide.
If the whole browser feels slow
The ladder above fixes ZHERO showing the wrong thing. It cannot fix ZHERO being slow at showing the right thing, because that is usually not happening inside ZHERO at all.
In a small number of cases we have traced persistent slowness to the browser installation itself rather than to any single extension. The symptom is distinctive: every extension feels sluggish, not just ZHERO, and the slowdown built up gradually over months rather than appearing after an update. Work through these in order, from least to most invasive.
-
Confirm it is not just ZHERO. Open a few other sites and use your other extensions. If they feel slow too, the cause is browser-wide and the steps below apply. If only ZHERO is slow, go back to the ladder above and report the issue.
-
Test with your other extensions disabled. Turn off every extension except ZHERO, reload the Zscaler console and compare. Extensions that filter or inspect network traffic (ad blockers, privacy tools, some password managers) sit in front of the requests that all other extensions make, so a single heavy one can slow down everything else in the browser. If this is the cause, re-enable your extensions one at a time to find which one.
-
Try a new browser profile. Create a fresh profile, install ZHERO in it and sign in to the Zscaler console. This takes a couple of minutes, changes nothing in your existing profile and is the cleanest way to tell a worn-out profile from a genuine problem. If the new profile is fast, you can simply keep working in it.
-
Reinstall the browser. As a last resort, and only if a new profile did not help, uninstall and reinstall the browser. We have seen this restore normal performance on installations several years old that had accumulated a long history of extensions. Afterwards you will need to install ZHERO again and sign in.
When to report an issue
To report an issue:
- If you can, reproduce the problem first: trigger the error again right before sending the report, so the diagnostic logs capture it.
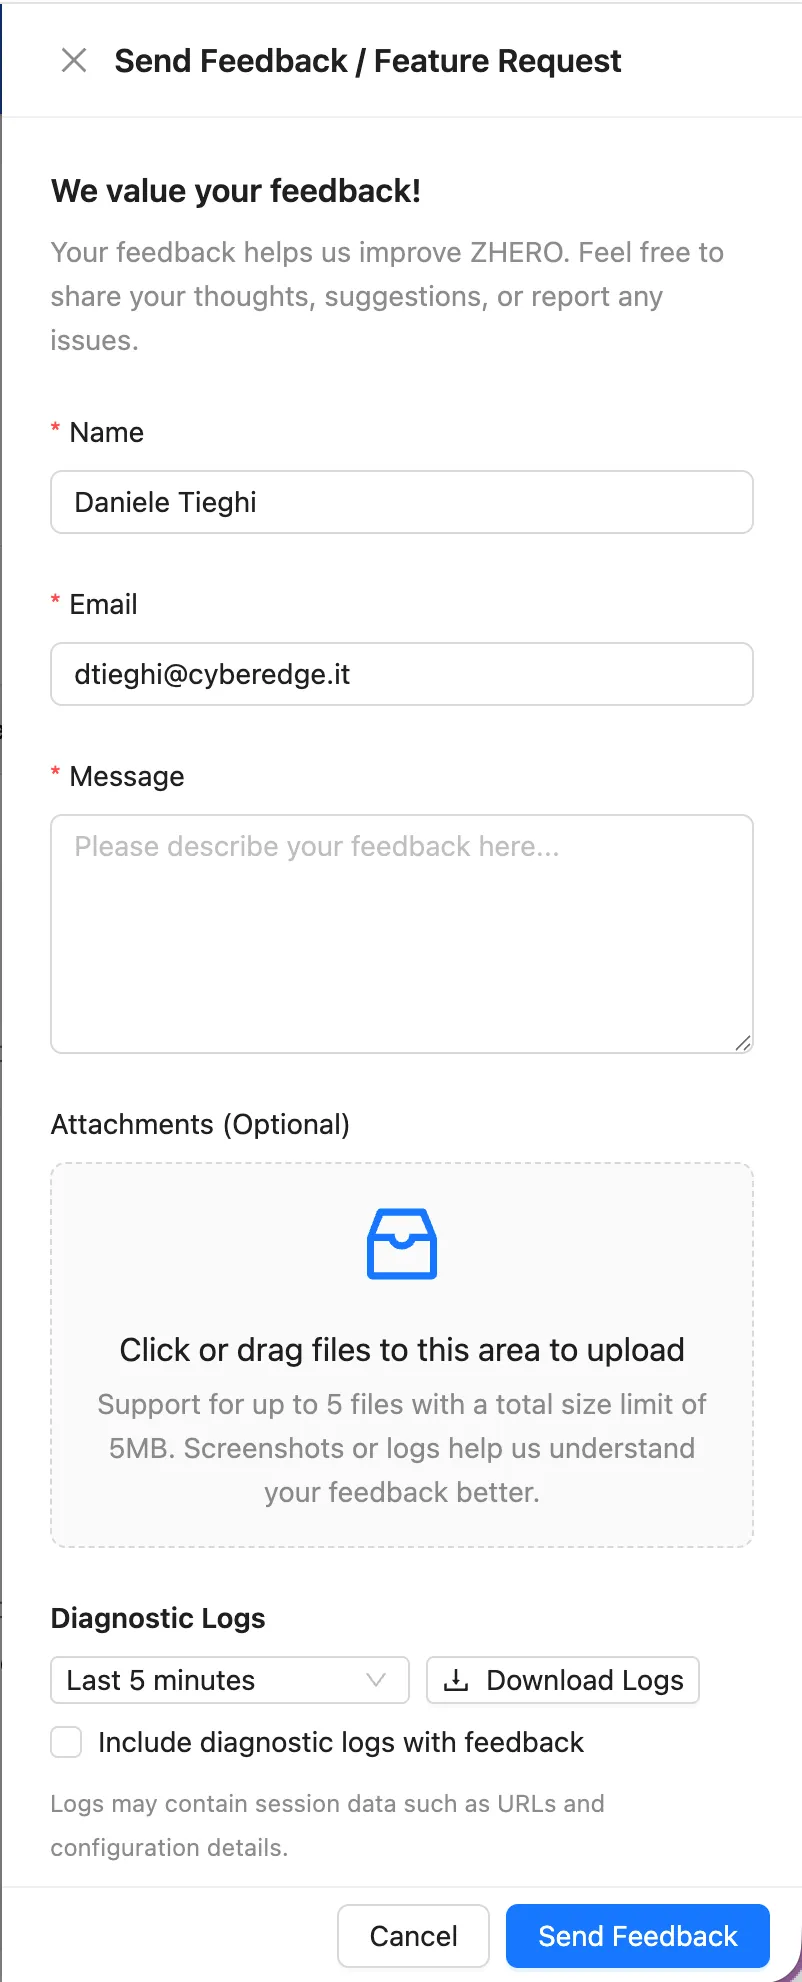
- Hover over the ZHERO icon in the Zscaler console header and choose Send Feedback / Feature Request.
- Describe what happened, what you expected and the steps that led there. You can attach up to 5 files (5MB total), for example screenshots of the issue.
- Under Diagnostic Logs, pick a time window that covers the problem (from the last 5 up to the last 30 minutes) and check Include diagnostic logs with feedback before sending.