Getting Around ZHERO
ZHERO has no console of its own. It lives inside the Zscaler admin interface, so everything you need is reachable from one floating icon and from the entities already on your screen. This page is the map: what the icon opens, what the badges mean, and how to get anywhere in two keystrokes.
Read it once after installing and the rest of the manual will make sense.
The ZHERO icon
The ZHERO icon floats over the Zscaler console. It does three things:
- Hover it to open the button row, the fastest way to any ZHERO surface.
- Click it to open a dropdown of console-level actions.
- Read it: while the menu is closed, the icon carries a combined badge counting your open findings and pending changes. A grey icon means ZHERO cannot currently reach its backend.
If the icon sits over something you need to see, the dropdown has Hide this menu for 10 seconds.
The button row
Hovering the icon fans out the buttons. Which ones appear depends on your tenant and licence:
| Button | Opens |
|---|---|
| Exports (download) | The export menu: URL, firewall rules, locations, app and forwarding profiles, SSL inspection, URL filtering, cloud app rules, ZPA access policies, ZPA application segments |
| Search (magnifier) | Universal search, also on Cmd/Ctrl+J |
| Troubleshooting Engine (wrench) | The ZIA troubleshooting drawer |
| Dashboards (gauge) | Entities, ZCC Fleet, Posture Insights, ZPA Infrastructure |
| Collaboration (people) | The hub: To-dos, Activity, Config, and for tenant admins Audit Trail and Data Health |
| Analysis Engine (lightbulb) | The findings drawer. Badge counts critical, high and medium |
| Pending Changes (gear) | The staging queue. Badge colour distinguishes personal, team and mixed |
On tenants that are not on the full version, a Discover Full ZHERO button appears at the top of the row.
The dropdown menu
Clicking the icon opens the console-level actions:
| Item | What it does |
|---|---|
| Hide this menu for 10 seconds | Gets the icon out of the way |
| Rescan page for UI enhancements | Re-applies badges and enhancements to the current page |
| ZHERO Help Portal | Opens this documentation |
| Send Feedback / Feature Request | Opens the feedback form, with diagnostics you can review before sending |
| Settings | The settings drawer |
| Reload | Force a data refresh, per entity type (see below) |
| Admin (tenant admins) | Tenant-level actions, in a submenu |
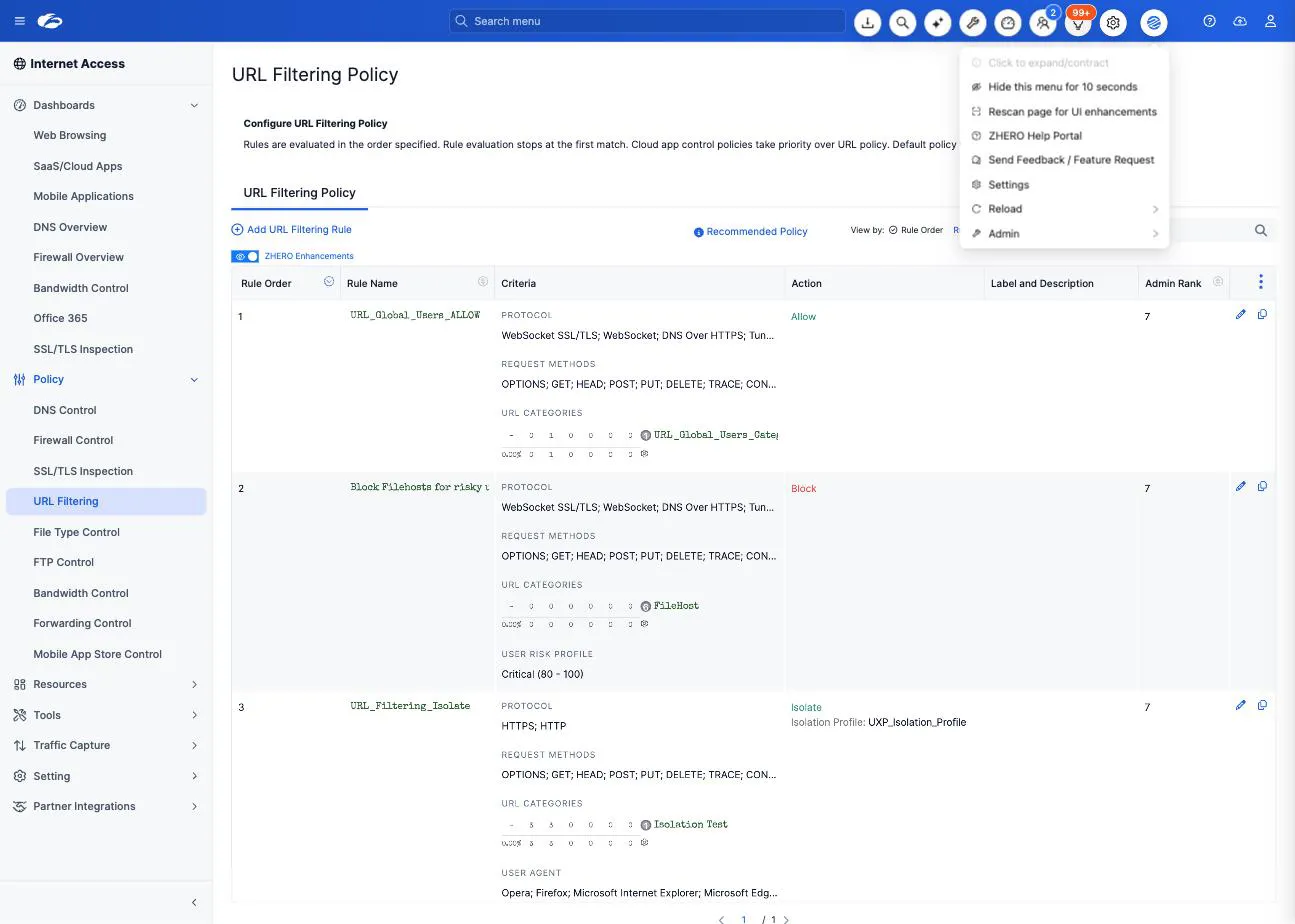
When the terms of service change, a Terms updated entry appears at the top with the days left in the grace period and a link to review them.
Entities: badge, hover, drawer
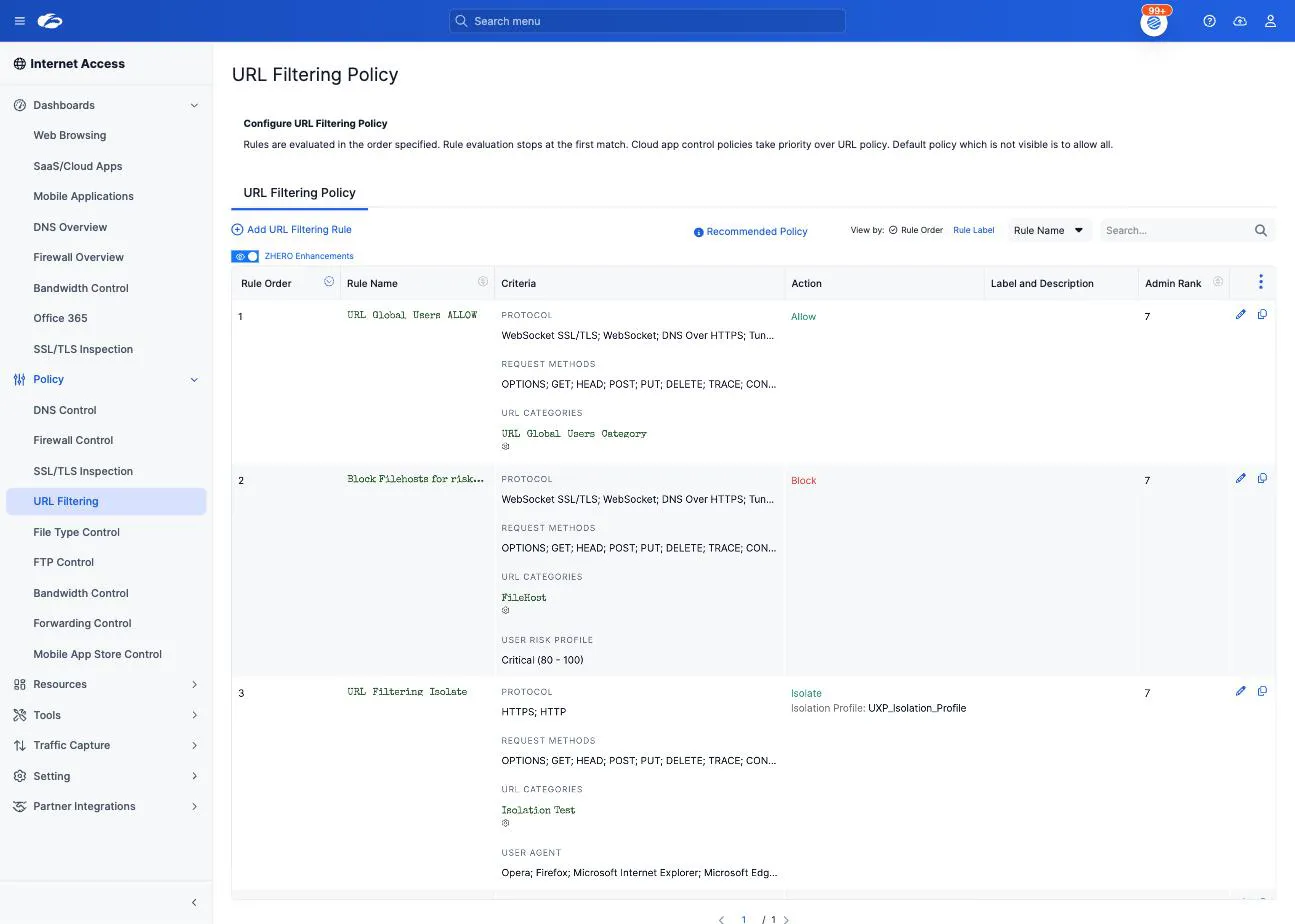
This is the pattern that repeats everywhere in ZHERO. Wherever the Zscaler console shows an entity, a location, a URL category, a user group, an application segment, ZHERO adds three progressive levels of information:
- The badge. A usage counter rendered inline next to the entity, for example “used in 12 policies”. It reads from local data, so it appears immediately rather than after an API call.
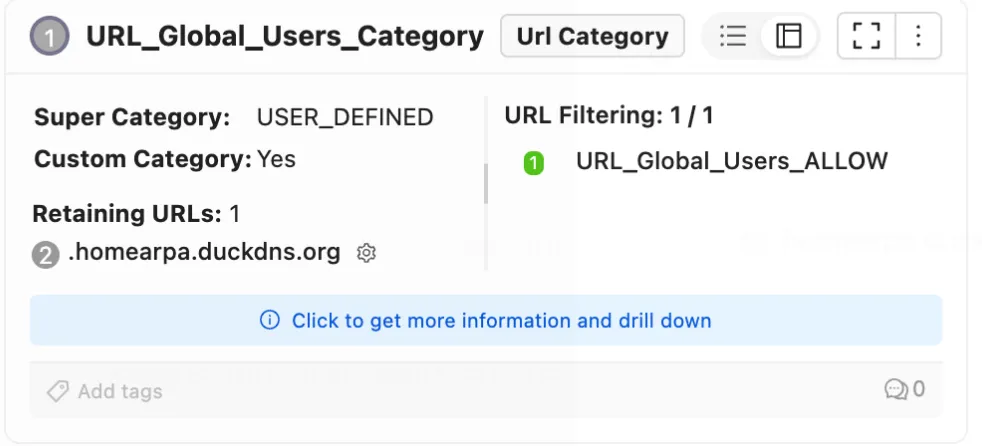
- The hover card. Hover the entity for its configuration, the policies that use it, recent traffic where Zscaler exposes it, and when it last changed.
- The drill-down drawer. Click for the full picture, without leaving the page you are on.
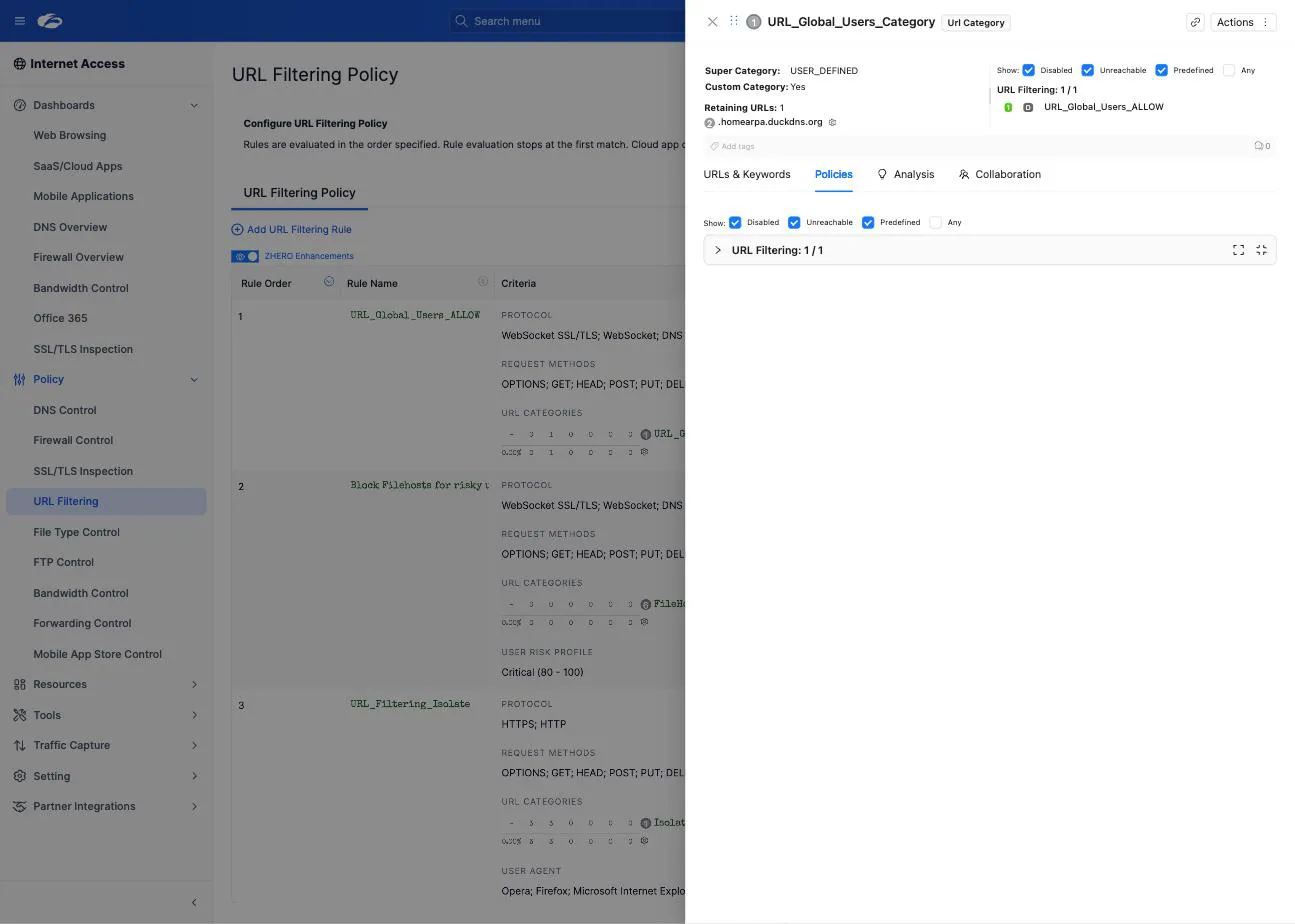
The drawer’s tabs depend on the entity type, because a URL category and a location do not have the same anatomy. A URL category opens on URLs & Keywords, Policies, Analysis and Collaboration; other types show Details and, where the entity supports it, Audit Logs. The recurring ones are:
- Policies: every rule that uses this entity, with filters for Disabled, Unreachable, Predefined and Any
- Analysis: the findings on this entity
- Collaboration: tags, comments and linked to-dos
- Audit Logs: the last 30 days of changes to this entity, with field-level diff
Inside the drawer, every referenced entity is itself clickable, so you can follow a dependency chain as far as it goes and come back. The drawer can be widened by dragging its edge.
Usage types
Badges and policy lists distinguish how an entity is used:
| Marker | Meaning |
|---|---|
| D | Direct: the entity is named in the policy criteria |
| G | Group: the entity is included through a group that the policy names |
| A | Any: the entity is covered indirectly by an “Any” criterion. Hidden by default |
That distinction is usually the answer to “why does this user have this access”.
Universal search
Press Cmd/Ctrl+J anywhere in the console, including on log pages. The search panel opens as a draggable window.
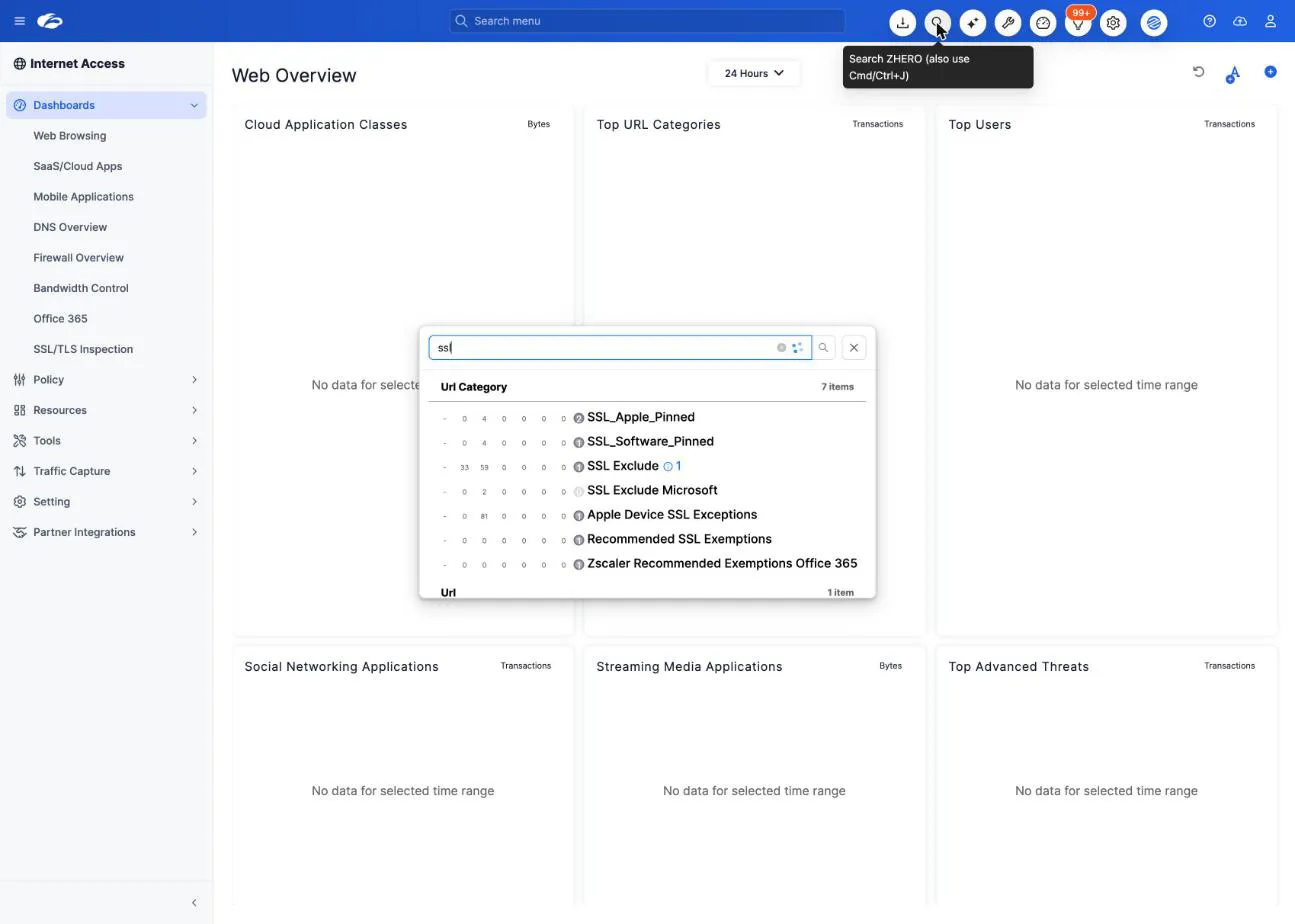
- Type at least 3 characters. Results appear as you type.
- Select text first, then press Cmd/Ctrl+J, and ZHERO searches for the selection immediately. This is the fastest way to look up a URL or an object name pasted into a ticket.
- Navigate the results from the keyboard and press Enter to jump to the entity.
- On Experience Center tenants, users and user groups are shared between planes, so an entity shows its ZIA policies and its ZPA policies together, with links to jump between them.
When the data looks stale
ZHERO detects configuration changes and reloads on its own. Two manual controls exist for the cases it cannot see, typically a change another admin made in a different session.
| Control | Use it when |
|---|---|
| Rescan page for UI enhancements | The page renders without ZHERO badges or cards, usually because the page finished loading before ZHERO initialised |
| Reload → (entity type) | The data is there but out of date. Search the entity type in the reload menu and click it to force a refresh of just that type |
If neither helps, the troubleshooting ladder covers the rest.
Display preferences
- Dark mode follows the Zscaler console theme automatically. There is no separate setting.
- Compact and Detailed views toggle throughout ZHERO, and the preference is remembered per surface.
- Drawers and side panels are resizable by dragging their edge.
- Policy table enhancements can be switched off with the toggle above a policy table, when you need to see the console exactly as Zscaler renders it. The state is remembered per table.
Limits and notes
- Availability varies by tenant type. ZIA, ZPA and Experience Center tenants expose different surfaces, and some features are licence-gated. A button you do not see is a feature that is not active for you.
- Incognito and private windows are detected: ZHERO reports that features are unavailable rather than failing in odd ways.
- Session expiry shows as an orange ”!” badge on the extension icon in the browser toolbar. It clears when you log in again.
- A restricted Zscaler admin role limits what ZHERO can show. Objects your role cannot read are not analysed, and the affected features degrade rather than error.
FAQ
The ZHERO icon is grey. What does that mean? ZHERO cannot currently reach its backend. In-console enhancements that work on local data keep running; anything needing the backend waits. Check connectivity, then the troubleshooting page.
Can I move the ZHERO icon? The search panel is draggable. The icon itself is fixed, but the dropdown can hide it for 10 seconds when it is in the way.
Cmd/Ctrl+J does nothing on a page. That shortcut needs the ZHERO content script to be active on the page. Use the Search button in the button row instead, and if the row is missing too, rescan or refresh.
Why do some entities have no badge? Either the entity type is not one ZHERO enhances on that screen, or the page rendered before ZHERO finished initialising. Rescan the page.
Where did the Help and Feedback buttons go? They moved into the dropdown you get by clicking the ZHERO icon, so they stay reachable even when the button row is collapsed.
Related pages
- Installation Guide: getting the extension in place
- OneAPI Configuration: unlocking the templates and lookups that need it
- Analysis Engine
- Pending Changes
- Troubleshooting
Next steps
- Hover the ZHERO icon and open each button once, to know what is behind it
- Hover an entity in a policy list, then click it, and follow one dependency chain
- Select a URL somewhere in the console and press Cmd/Ctrl+J
- Learn the reload menu now, so stale data never turns into a mystery later