Troubleshooting Engine
“Site X does not work for user Y” is the most common ticket a Zscaler team receives and the most tedious to answer, because the answer is spread across forwarding profiles, a dozen policy types and the logs. The Troubleshooting Engine puts the criteria in one panel and the answer in three tabs.
It is for help desk and operations: the people who need a root cause, not a theory.
When to use it
- An access ticket: a user, a location or a device cannot reach a destination.
- A forwarding question: traffic is leaving through the wrong path or the wrong cloud.
- A page that half works: the main site loads, something inside it does not. That is the HAR case.
- A shift handover: save the session and let the next engineer resume exactly where you stopped.
Where to find it in the UI
Hover the ZHERO icon and click the Troubleshooting Engine button (wrench icon). The drawer opens nearly full width and is labelled BETA.
Step by step
-
Build the criteria. In the left panel, pick what defines the case: users, devices, locations, departments, and the destination. This is the “who and where to” of the ticket.
-
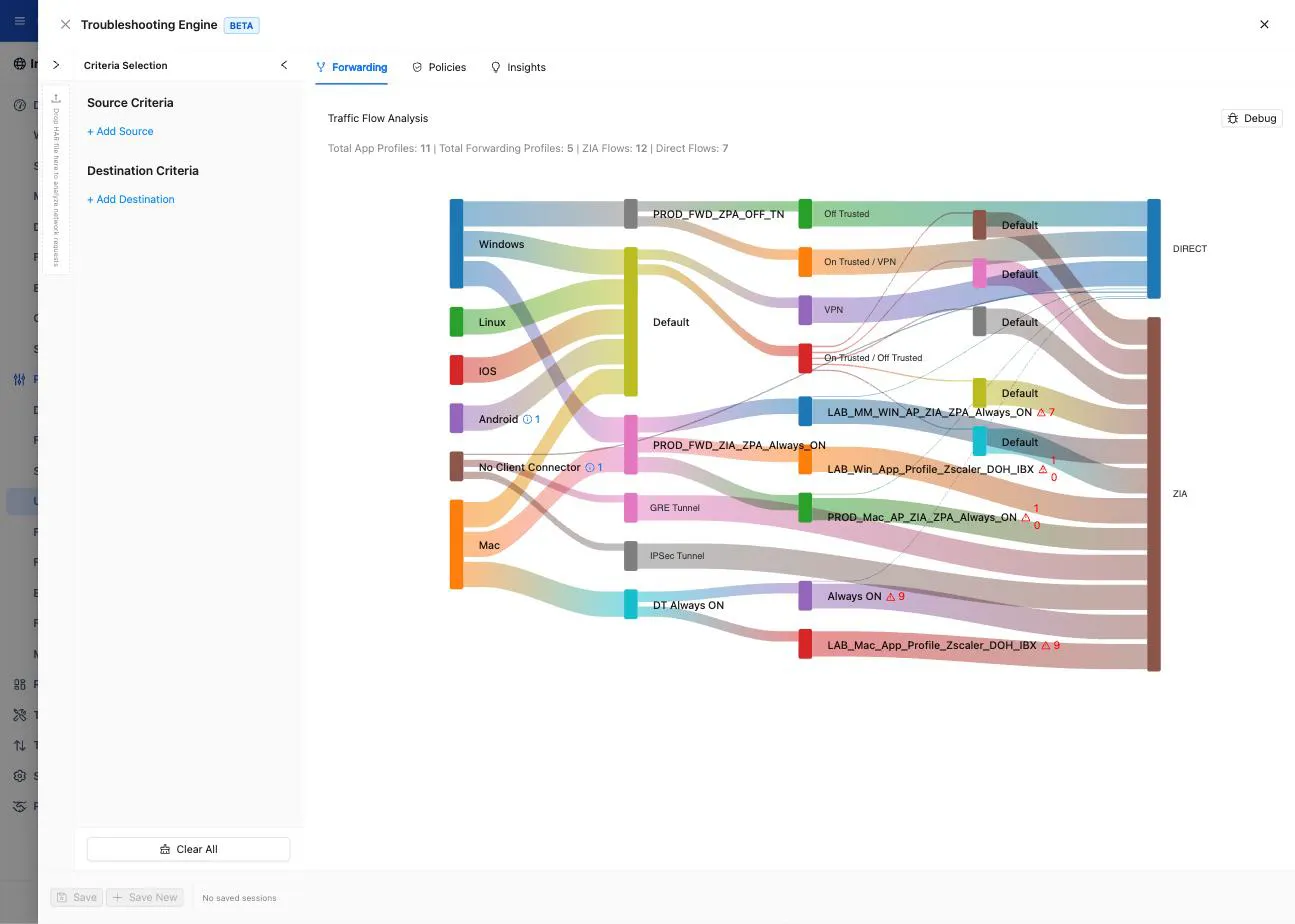
Read the Forwarding tab. The traffic flow is drawn as a Sankey diagram running through device groups, app profiles, ZCC settings and forwarding profiles. A misassigned forwarding profile is visible as a path going somewhere you did not expect.
-
Read the Policies tab. For the criteria you selected, ZHERO shows which rules match, per policy type, with the action and the rule order. Eleven policy types are covered:
Firewall rules DNS rules IPS rules Forwarding rules SSL Inspection URL Filtering Cloud App rules File Type rules DLP rules Sandbox rules Bandwidth rules Rules that are unreachable for these criteria are marked as such, which is often the answer on its own: the rule everybody assumed was doing the work never runs.
-
Read the Insights tab. This queries the real ZIA traffic logs for the same criteria: actual transactions, what was blocked and why, over a time window. Configuration says what should happen; Insights says what did.
-
If the case needs it, add a HAR. Drag a HAR file into the panel. ZHERO parses it in the browser, extracts the domains, groups the errors (4xx, 5xx, TLS failures), and lets you select the domains that matter so the rest of the analysis narrows to them.
-
Save the session. Save the current session, or save it as a new one, and reload it later from the session list.
What to watch
- The order of the matching rules. The first match wins, so a permissive rule above a specific one explains a lot of “but we have a rule for that”.
- The gap between Policies and Insights. Configuration allows it, logs show it blocked: look for something outside the policy set, starting with the forwarding path.
- The intersection versus the union of criteria. Selecting several criteria together tells you what applies to all of them; that is usually what the ticket is about.
- Third-party calls in a HAR. A page that “does not work” is frequently three background API calls to a domain nobody thought to allow.
Limits and notes
- The drawer is labelled BETA.
- This is a ZIA engine. The ZPA equivalent is the ZPA Diagnostics Engine.
- HAR analysis happens entirely in your browser. The file is parsed locally and never uploaded. Note that a HAR captured from a browser session can contain sensitive data, including cookies and headers: handle the file itself with the same care you would give a credential.
- Sessions are stored locally in your browser. They survive a reload; they do not follow you to another machine.
- Insights needs the log query to be available to your admin role. Where it is not, the configuration tabs still work.
- The engine needs the full licence. On a trial the wrench button opens a premium-feature panel instead of the drawer, naming what the engine does rather than failing silently.
FAQ
Does anything I analyse here leave my browser? The HAR parsing and the policy matching run locally. The Insights tab queries Zscaler’s own logs through your authenticated session, exactly as the console would.
How do I capture a HAR file? In the browser, open the developer tools on the Network tab, reproduce the problem, then export the requests as a HAR. Capture only the reproduction: a HAR of a long session is both harder to read and more sensitive.
Can I share a session with a colleague? Sessions are local to your browser. For a handover in the same team, the practical route is a to-do with the findings in a comment, linked to the entities involved.
The Policies tab shows a rule as unreachable, but the user is definitely being blocked. Then the block comes from a different rule or a different policy type. Widen the view: the tab shows every policy type at once for exactly this reason.
Why is the Forwarding tab empty? The criteria selected do not resolve to a forwarding path, usually because no device or location criterion is set. Add one.
Related pages
- ZPA Diagnostics Engine: the private-access side
- Unreachable Policy Detection: why a rule never runs
- Traffic Analytics: volumes per rule, category and location
- Getting Around ZHERO
Next steps
- Take your next access ticket and rebuild it as criteria instead of guessing
- Compare the Policies tab with the Insights tab before you change anything
- Ask the reporter for a HAR the next time a page only half works
- Save the session before your shift ends