Unified Audit Timeline
Two audit trails have always existed and never met: what your team did through ZHERO, and what was changed in the Zscaler tenant. The Audit tab merges them into one chronological timeline, so the change nobody ran through the process is visible next to the ones that were.
It is for tenant admins, and for anyone who has spent an afternoon reconciling two exports.
When to use it
- The out-of-band change: something broke, nobody on the team executed anything, and you need to know what moved and who moved it.
- The quarterly review: one chronological view instead of two exports and a spreadsheet.
- Investigating a collaboration change: who removed that tag, when, and what else happened at the same time.
- Compliance evidence: an Excel export of the filtered period.
Where to find it in the UI
Hover the ZHERO icon, click Collaboration, and open the Audit Trail tab. It is visible to tenant admins.
The default window is the last 30 days.
Step by step
- Set the period. Presets run from the last day to the last month, plus a custom range.
- Choose the sources. A toggle includes or excludes the Zscaler audit log alongside ZHERO team activity. Note that Zscaler entries are hidden while an action or target filter is active, since those filters describe ZHERO actions.
- Filter. By action type, by target type, or by actor name.
- Read the timeline. The Source column labels every row: team activity recorded by ZHERO, or a change recorded in your Zscaler audit log. The Actor column names who did it, a teammate or a Zscaler administrator.
- Open a diff. Rows sourced from Zscaler carry a diff control that shows the fields the change touched, as recorded in the audit log itself. The same diff is available in the Audit Logs tab of any entity drawer.
- Click through to the entity. Audit rows reference the real entity, so the hover card and the drill-down drawer work exactly as everywhere else in ZHERO.
- Export the filtered view to Excel when the review needs an attachment.
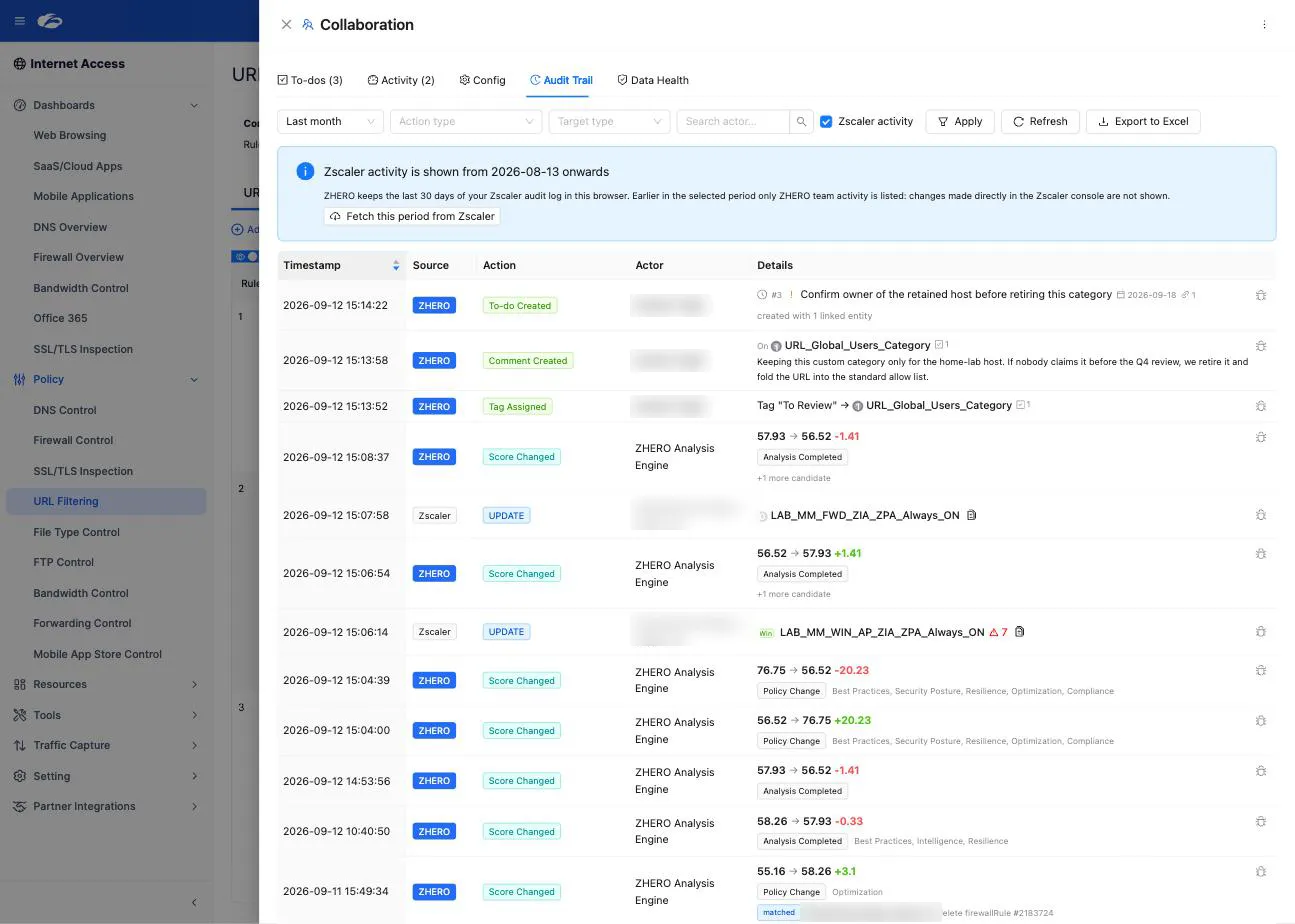
The coverage banner
The two sources do not cover the same span, and ZHERO says so rather than letting you infer it from a suspiciously empty timeline.
ZHERO keeps the last 30 days of your Zscaler audit log in this browser. If your selected period reaches further back, a banner appears stating the date from which Zscaler activity is shown, and warning that earlier in the period only ZHERO team activity is listed: changes made directly in the console are not shown for that stretch.
When that happens, Fetch this period from Zscaler runs a live query for the selected range and fills the gap. Each range is fetched once.
What to watch
| Signal | What it usually means |
|---|---|
| A Zscaler-sourced change with no ZHERO row near it | Someone worked directly in the console, outside the team process |
| A burst of changes by one actor at an odd hour | Worth a diff, and probably a conversation |
| An entity with executed changes and no collaboration activity | Nobody tagged, commented or tracked it. Fine once, a pattern worth fixing |
| A tag removed from a rule marked as critical | The audit row names who removed it and when |
Limits and notes
- Zscaler rows never leave your browser. They are read from a local store, or fetched live from Zscaler through your own session, and are not sent to ZHERO.
- 30 days of local Zscaler coverage. Beyond that, the live fetch is how you look further back, within what the Zscaler audit log itself retains.
- Executed-change entries in the ZHERO cloud are reference-only: which entity changed, never how. The field-level diff you see comes from your local 30-day store, or from the Zscaler audit log’s own payload. See Privacy and data.
- Audit data is tenant-isolated, and the tab is for tenant admins.
- Action and target filters are ZHERO-side. Applying one hides the Zscaler stream, because those categories do not exist on the other side.
- The timeline pages in: Load More extends it rather than loading a month at once.
FAQ
Why can I see a change that nobody made through ZHERO? Because that is the point. The Zscaler audit log records changes made directly in the console, and the merged timeline shows them with their own source label and actor.
Does ZHERO store my Zscaler configuration to produce these diffs? No. Cloud-side entries record the entity reference only. Diffs come from your local store or from the Zscaler audit payload, both of which stay in your browser.
The timeline looks empty for last month. Check the coverage banner. Local Zscaler coverage is 30 days; beyond that, use “Fetch this period from Zscaler”.
Can I see the audit for just one entity? Yes, on the entity types that carry one. Their drawer has an Audit Logs tab showing the last 30 days of changes to that entity, with the same field-level diff. The drawer’s tabs depend on the entity type, so a URL category, for instance, does not have it.
Is the export the whole log or what I filtered? What you filtered. Set the period and the filters first, then export.
Related pages
- Tags and Comments: the team activity half of the timeline
- Pending Changes: where executed changes come from
- Security Posture Dashboard: score attribution reconciles against this same audit data
- Privacy and data: what is stored where
Next steps
- Open the Audit tab with both sources on and read a normal week
- Find one Zscaler-sourced row and open its diff
- Set a period longer than 30 days and see the coverage banner do its job
- Export a quarter and compare the effort with the two-export reconciliation you used to do